OPEN-SOURCE SCRIPT
Relative Strength, not RSI
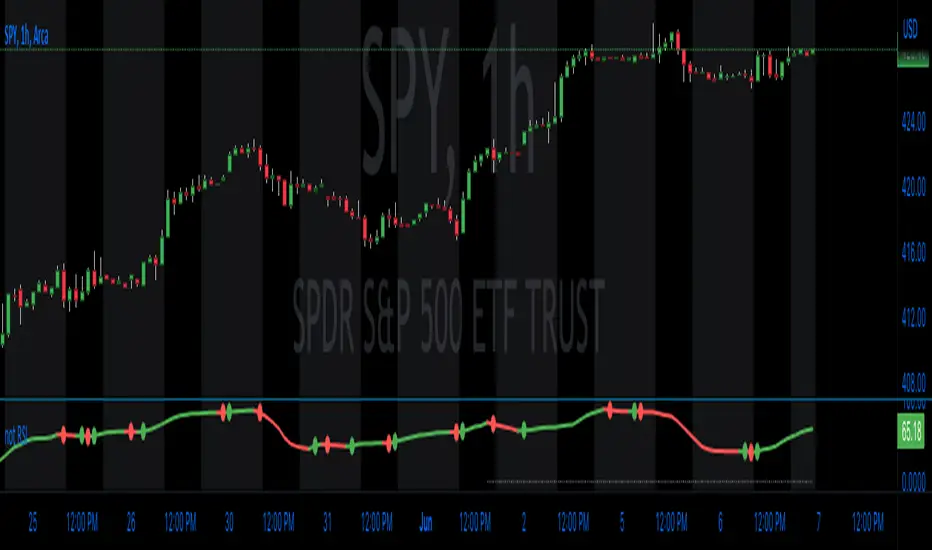
The Smoothed Relative Strength Indicator (not RSI) with Multi-Timeframe Support is a custom indicator that combines the concepts of Relative Strength (not RSI) and Money Flow Index (MFI) to create a smoothed trend-following tool. It works on any timeframe and adapts to different market conditions.
Key Features:
Multi-timeframe support:[ The script uses the request.security function to fetch data from other timeframes, allowing users to analyze the trend on different timeframes simultaneously.
Relative Strength calculation: The script calculates the Relative Strength (not RSI) by averaging the gains and losses over a user-defined period (len).
Money Flow Index calculation: The script calculates the Money Flow Index (MFI) by considering both price and volume data. The MFI is an oscillator that ranges between 0 and 100, and it helps identify overbought or oversold conditions in the market.
Combination of Relative Strength and MFI:The indicator calculates the average of Relative Strength and MFI values to create the Trend Reversal Strength (TRS) line.
Smoothing the TRS line: The TRS line is smoothed using a Simple Moving Average (SMA) with a user-defined smoothing length (smoothLen). This helps to reduce noise and make the trend more readable.
Trend color determination: The script determines the trend color based on the slope of the smoothed TRS line. If the current value of the smoothed TRS line is higher than the previous one, the line is colored green (uptrend). If the current value is lower than the previous one, the line is colored red (downtrend).
Visual representation of trend changes: The indicator plots small circles at points where the trend color changes, making it easier to identify potential trend reversal points.
Zero line: The script draws a horizontal line at the zero level to help users gauge the market's strength or weakness relative to this level.
Usage:
This indicator can be used as a trend-following tool to identify potential entry and exit points in the market. When the smoothed TRS line is green and rising, it suggests a bullish trend, and traders may consider entering long positions. Conversely, when the smoothed TRS line is red and falling, it indicates a bearish trend, and traders may consider short positions or exiting long trades.
Please note that this indicator should be used in conjunction with other technical analysis tools and proper risk management techniques to improve the accuracy of your trading decisions.
Açık kaynak kodlu komut dosyası
Gerçek TradingView ruhuna uygun olarak, bu komut dosyasının oluşturucusu bunu açık kaynaklı hale getirmiştir, böylece yatırımcılar betiğin işlevselliğini inceleyip doğrulayabilir. Yazara saygı! Ücretsiz olarak kullanabilirsiniz, ancak kodu yeniden yayınlamanın Site Kurallarımıza tabi olduğunu unutmayın.
Feragatname
Bilgiler ve yayınlar, TradingView tarafından sağlanan veya onaylanan finansal, yatırım, işlem veya diğer türden tavsiye veya tavsiyeler anlamına gelmez ve teşkil etmez. Kullanım Şartları'nda daha fazlasını okuyun.