OPEN-SOURCE SCRIPT
Güncellendi Beyond Insights Indicator
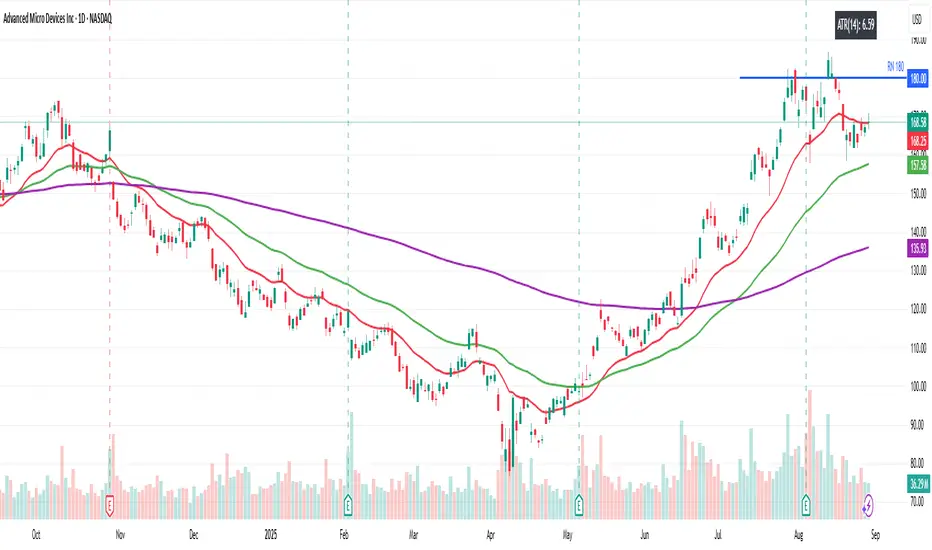
The Beyond Insights Indicator is a multi-timeframe overlay tool designed for TradingView that displays key Exponential Moving Averages (EMAs) and volatility insights to support various trading strategies. It intelligently adapts its display based on the current chart timeframe to reduce clutter and enhance relevance. Specifically, it shows EMA 6, 18, and 50 when viewing intraday timeframes.
In addition to EMAs, the indicator includes an ATR (Average True Range) calculation with a default length of 14, offering insight into market volatility.
In addition to EMAs, the indicator includes an ATR (Average True Range) calculation with a default length of 14, offering insight into market volatility.
Sürüm Notları
Purpose of the Script:When you switch between Monthly/Weekly/Daily charts, you only see the corresponding EMA20/50/200 lines (styled slightly differently to indicate the timeframe).
When you drop to any intraday chart (1 min, 5 min, 1 hour…), you instead see faster EMAs (6, 18, 50) suited to that shorter timeframe.
No matter which timeframe you’re on, there’s always a small overlay table in the top-right showing the current 14-period ATR reading.
The ATR reading in the corner gives you an immediate sense of current volatility without opening a separate indicator pane.
Sürüm Notları
Updated ATR to Two Decimal.Make the ATR more visible (Shifted to left)
Açık kaynak kodlu komut dosyası
Gerçek TradingView ruhuyla, bu komut dosyasının mimarı, yatırımcıların işlevselliğini inceleyip doğrulayabilmesi için onu açık kaynaklı hale getirdi. Yazarı tebrik ederiz! Ücretsiz olarak kullanabilseniz de, kodu yeniden yayınlamanın Topluluk Kurallarımıza tabi olduğunu unutmayın.
Feragatname
Bilgiler ve yayınlar, TradingView tarafından sağlanan veya onaylanan finansal, yatırım, alım satım veya diğer türden tavsiye veya öneriler anlamına gelmez ve teşkil etmez. Kullanım Koşulları bölümünde daha fazlasını okuyun.