OPEN-SOURCE SCRIPT
Donchian Cloud - evo
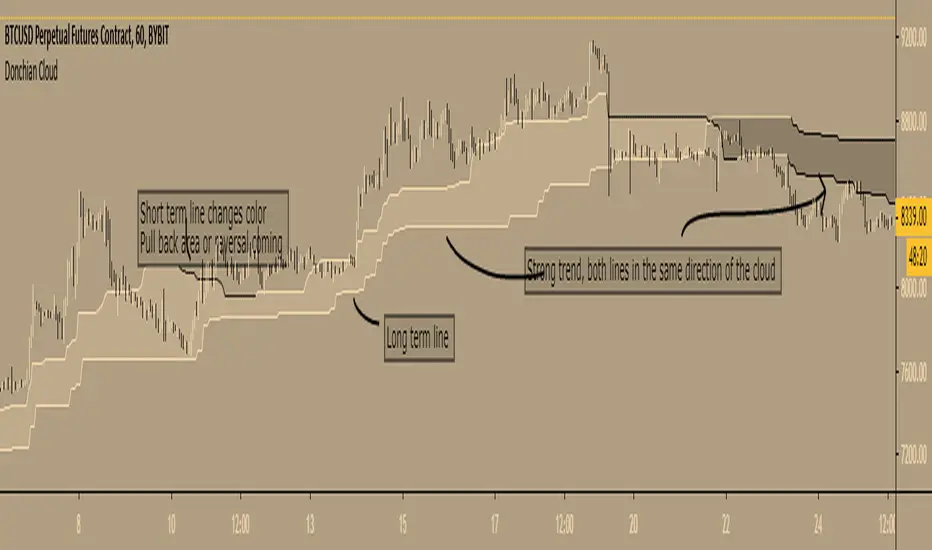
A cloud based on the highest high and lowest low of a given period (Donchian), same lines used in Ichimoku Cloud (Conversion line or Base line).
Short term line is based on current time frame, long term line is based on your given multiple of current time frame.
The color of the lines is based on up or down movement.
I stole a piece of code from PineCoders for the multiple time frame:
I have not used this in my trades (yet) so I don't know how good it is, just posting because it looks nice :)
Feel free to share your settings if you can find good ones.
Açık kaynak kodlu komut dosyası
Gerçek TradingView ruhuyla, bu komut dosyasının mimarı, yatırımcıların işlevselliğini inceleyip doğrulayabilmesi için onu açık kaynaklı hale getirdi. Yazarı tebrik ederiz! Ücretsiz olarak kullanabilseniz de, kodu yeniden yayınlamanın Topluluk Kurallarımıza tabi olduğunu unutmayın.
Feragatname
Bilgiler ve yayınlar, TradingView tarafından sağlanan veya onaylanan finansal, yatırım, alım satım veya diğer türden tavsiye veya öneriler anlamına gelmez ve teşkil etmez. Kullanım Koşulları bölümünde daha fazlasını okuyun.