OPEN-SOURCE SCRIPT
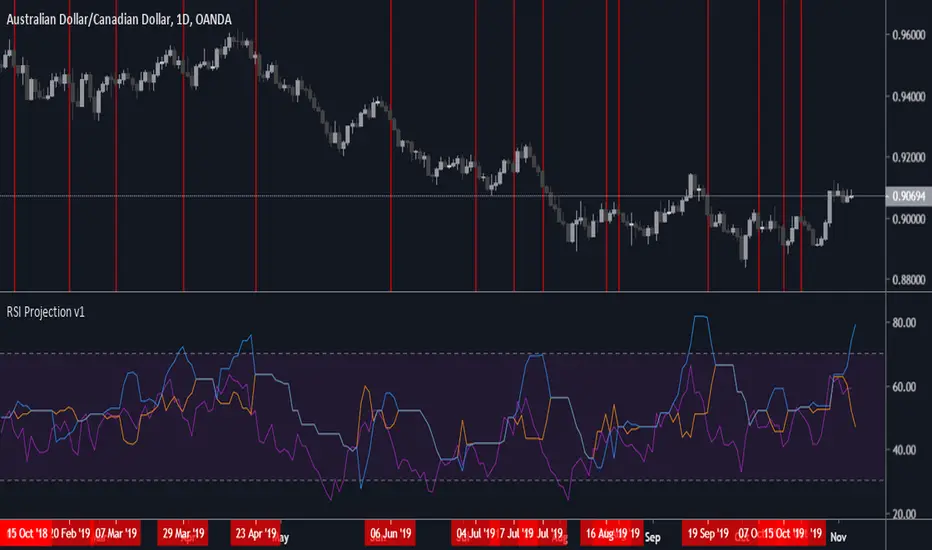
RSI Projection v1
Application of concepts from Constance Brown "Technical Analysis for Trading Professionals", specifically: Chapter 7: Price Projections By Reverse Engineering Indicators, and Chapter 8: Price Objectives Derived From Positive and Negative Reversals In The RSI.
Specifically: I wanted to see if better Exit signals for the RSI could be generated from a basic application of some of the concepts in those chapters, and that is what I've found so far:
Specifically: I wanted to see if better Exit signals for the RSI could be generated from a basic application of some of the concepts in those chapters, and that is what I've found so far:
- Exit when the RSI (purple) crosses below the orange line
- Orange line is forecasted RSI for positive price reversals, blue line is forecasted RSI for negative price reversals
- From what I can tell, this indicator does not work well during chop/consolidation and ranging periods, generating too many false signals without additional confluence from trending indicators and price analysis
- This indicator should be considered highly experimental - do not use live trading without proper backtesting and parameter adjustment.
- Tuning per asset and timeframe is required due to calculation type for highs/lows used for projection calculations
Açık kaynak kodlu komut dosyası
Gerçek TradingView ruhuyla, bu komut dosyasının mimarı, yatırımcıların işlevselliğini inceleyip doğrulayabilmesi için onu açık kaynaklı hale getirdi. Yazarı tebrik ederiz! Ücretsiz olarak kullanabilseniz de, kodu yeniden yayınlamanın Topluluk Kurallarımıza tabi olduğunu unutmayın.
Feragatname
Bilgiler ve yayınlar, TradingView tarafından sağlanan veya onaylanan finansal, yatırım, alım satım veya diğer türden tavsiye veya öneriler anlamına gelmez ve teşkil etmez. Kullanım Koşulları bölümünde daha fazlasını okuyun.