OPEN-SOURCE SCRIPT
Güncellendi Momentum RSI
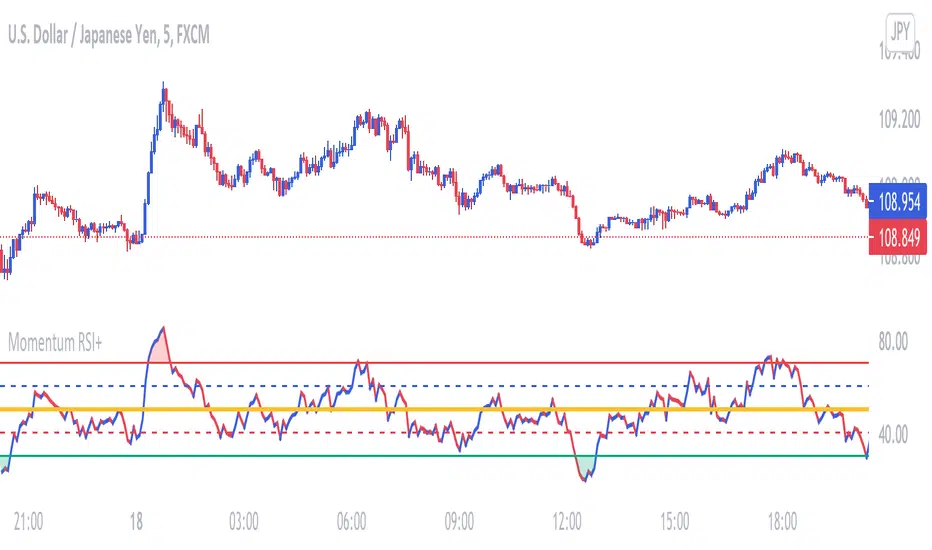
This RSI is used to determine price Momentum and Overbought or Oversold Market conditions. When the RSI is between 50% and 70% price is considered to have upward momentum. When The RSI is between 50% and 30% price is considered to have downward momentum. When the RSI is between 40% and 60% price is considered to have no directional momentum and is considered to be in consolidation. When the RSI is above 70% price is to be considered Overbought. When the RSI is bellow 30% price is to be considered Oversold
Sürüm Notları
Renamed Hlines and changed standard colorSürüm Notları
Style updateSürüm Notları
RSI Line color update to show momentumAdded Green shade when RSI is Overbought and Red shade when RSI is Oversold
Açık kaynak kodlu komut dosyası
Gerçek TradingView ruhuna uygun olarak, bu komut dosyasının oluşturucusu bunu açık kaynaklı hale getirmiştir, böylece yatırımcılar betiğin işlevselliğini inceleyip doğrulayabilir. Yazara saygı! Ücretsiz olarak kullanabilirsiniz, ancak kodu yeniden yayınlamanın Site Kurallarımıza tabi olduğunu unutmayın.
Feragatname
Bilgiler ve yayınlar, TradingView tarafından sağlanan veya onaylanan finansal, yatırım, işlem veya diğer türden tavsiye veya tavsiyeler anlamına gelmez ve teşkil etmez. Kullanım Şartları'nda daha fazlasını okuyun.