OPEN-SOURCE SCRIPT
Güncellendi Faust
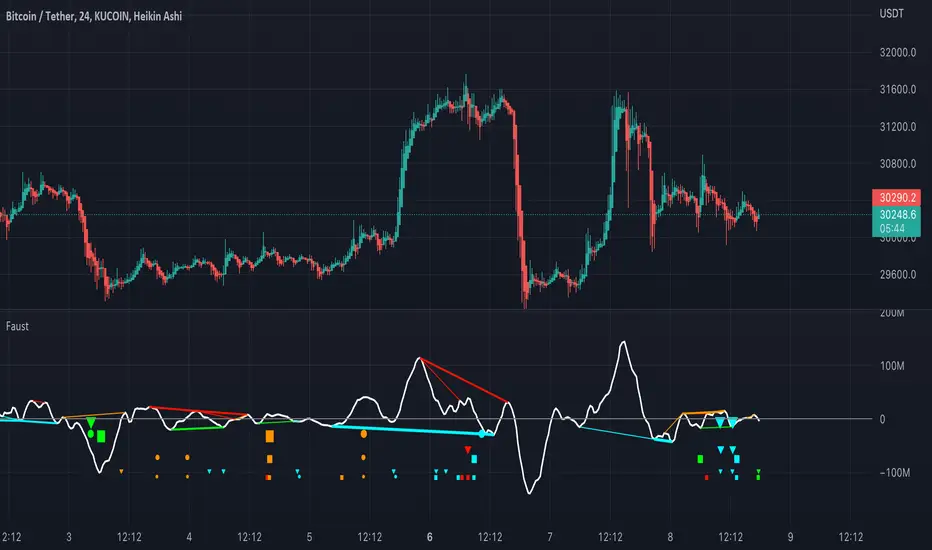
Faust is a composite indicator that combines 3 volume indicators: TSV, OBV, and PVT.
TSV moving average is plotted as an oscillator. OBV and PVT are calculated internally.
Four divergences are calculated for each indicator (regular bearish, regular bullish, hidden bearish, and hidden bullish) with three look-back periods (high, mid, and small).
For TSV, the fattest plotted line is the divergence with the highest look-back period, and the thinnest line is the divergence with the shortest look-back period.
For PVT, the larger the circle, the higher the divergence look-back period.
For OBV, the larger the triangle, the higher the divergence look-back period.
Sürüm Notları
Add CVD divs, fix colors.Sürüm Notları
Add TSV Oscillator ModeSürüm Notları
- Implemented a different method to draw divs for TSV to reduce the number of outputs on the chart and make space for the hidden div alerts.
- Added alerts for hidden divs
- Refactored inputs
Sürüm Notları
Fix the source bugSürüm Notları
Make hlc3 a default sourceAçık kaynak kodlu komut dosyası
Gerçek TradingView ruhuyla, bu komut dosyasının mimarı, yatırımcıların işlevselliğini inceleyip doğrulayabilmesi için onu açık kaynaklı hale getirdi. Yazarı tebrik ederiz! Ücretsiz olarak kullanabilseniz de, kodu yeniden yayınlamanın Topluluk Kurallarımıza tabi olduğunu unutmayın.
Feragatname
Bilgiler ve yayınlar, TradingView tarafından sağlanan veya onaylanan finansal, yatırım, alım satım veya diğer türden tavsiye veya öneriler anlamına gelmez ve teşkil etmez. Kullanım Koşulları bölümünde daha fazlasını okuyun.
Açık kaynak kodlu komut dosyası
Gerçek TradingView ruhuyla, bu komut dosyasının mimarı, yatırımcıların işlevselliğini inceleyip doğrulayabilmesi için onu açık kaynaklı hale getirdi. Yazarı tebrik ederiz! Ücretsiz olarak kullanabilseniz de, kodu yeniden yayınlamanın Topluluk Kurallarımıza tabi olduğunu unutmayın.
Feragatname
Bilgiler ve yayınlar, TradingView tarafından sağlanan veya onaylanan finansal, yatırım, alım satım veya diğer türden tavsiye veya öneriler anlamına gelmez ve teşkil etmez. Kullanım Koşulları bölümünde daha fazlasını okuyun.