OPEN-SOURCE SCRIPT
Bitcoin Fibonacci Log Regression
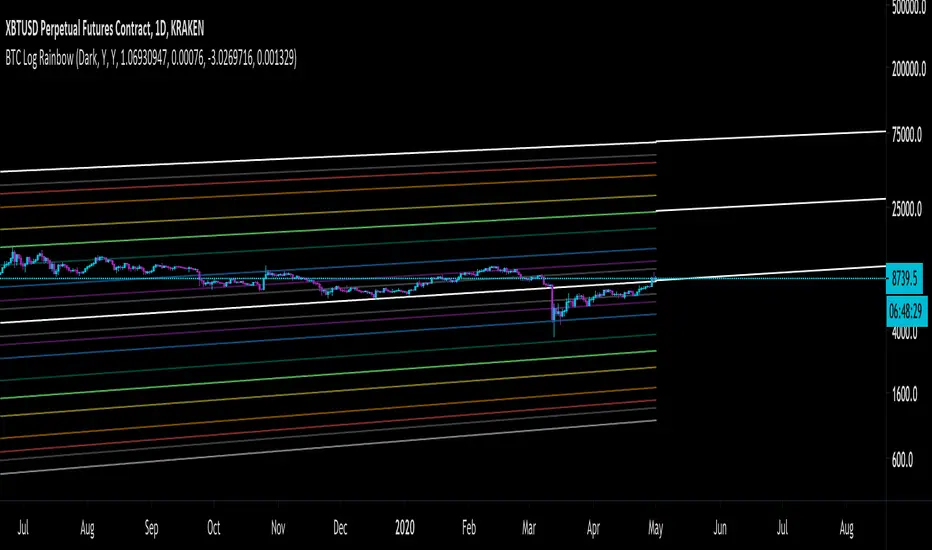
The "Zero Line" is the calculated logarithmic regression of Bitcoin over the last decade.
The rainbow above the Zero Line are the Fibonacci multiples from 0 --> 1 of the log regression (0.236, 0.382, etc.)
The rainbow below the Zero Line is identical, except that the multiples are negative (-0.236, -0.382, etc.)
For the first time ever, Bitcoin broke through the Zero Line (the natural regression) when it dumped on March 12-13. It looked at though the regression was invalidated when, in fact, it simply made an unprecedented move to a lower Fibonacci multiple.
Enjoy.
Açık kaynak kodlu komut dosyası
Gerçek TradingView ruhuyla, bu komut dosyasının mimarı, yatırımcıların işlevselliğini inceleyip doğrulayabilmesi için onu açık kaynaklı hale getirdi. Yazarı tebrik ederiz! Ücretsiz olarak kullanabilseniz de, kodu yeniden yayınlamanın Topluluk Kurallarımıza tabi olduğunu unutmayın.
Feragatname
Bilgiler ve yayınlar, TradingView tarafından sağlanan veya onaylanan finansal, yatırım, alım satım veya diğer türden tavsiye veya öneriler anlamına gelmez ve teşkil etmez. Kullanım Koşulları bölümünde daha fazlasını okuyun.