OPEN-SOURCE SCRIPT
% of stocks in spx above 200 ma— Simplified (30/70 levels)

S5TH Breadth Suite — Simplified (30/70 Levels)
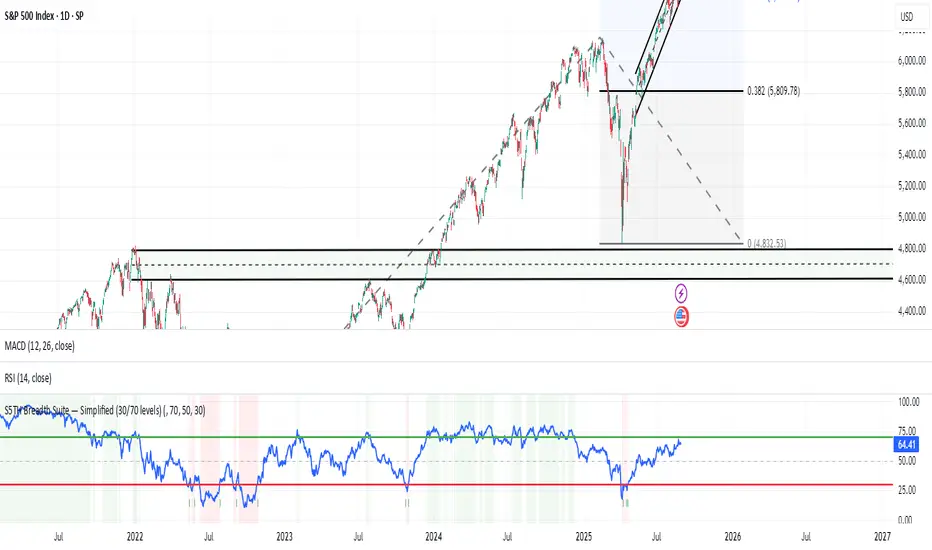
This indicator tracks the S&P 500 % of stocks above their 200-day moving average (S5TH), plotted on a 0–100 scale.
• Line Plot: Blue line shows the breadth percentage.
• Key Levels:
• 70 → Overbought zone
• 50 → Neutral midpoint
• 30 → Oversold zone
• Background Shading:
• Red tint = Oversold (<30)
• Green tint = Overbought (>70)
• Signals & Alerts:
• Circles mark midline crossovers.
• Arrows show exits from extreme zones (oversold/overbought).
• Alerts can be set for each condition.
✅ Clean design — no moving averages.
✅ Helps spot breadth extremes, reversals, and trend shifts.
✅ Works on any timeframe (default is chart TF).
Açık kaynak kodlu komut dosyası
Gerçek TradingView ruhuna uygun olarak, bu komut dosyasının oluşturucusu bunu açık kaynaklı hale getirmiştir, böylece yatırımcılar betiğin işlevselliğini inceleyip doğrulayabilir. Yazara saygı! Ücretsiz olarak kullanabilirsiniz, ancak kodu yeniden yayınlamanın Site Kurallarımıza tabi olduğunu unutmayın.
Feragatname
Bilgiler ve yayınlar, TradingView tarafından sağlanan veya onaylanan finansal, yatırım, işlem veya diğer türden tavsiye veya tavsiyeler anlamına gelmez ve teşkil etmez. Kullanım Şartları'nda daha fazlasını okuyun.