PROTECTED SOURCE SCRIPT
Dynamic Fib 61.8
Dynamic Fib 61.8 Indicator – Full Guide
1. Overview
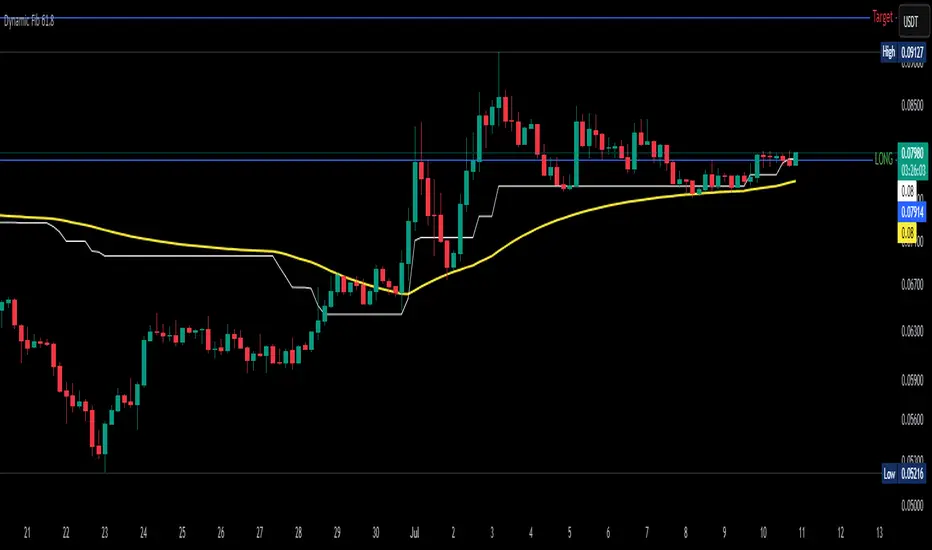
This indicator plots a dynamic 61.8% Fibonacci retracement level, adjusted for market volatility and smoothed using an EMA for cleaner signals. Unlike traditional static Fib levels, this version auto-adjusts based on recent price swings, making it more responsive to changing market conditions.
Key Features:
✅ Auto-Adjusting 61.8% Fib Level – Adapts to the highest high/lowest low over a user-defined period.
✅ EMA Smoothing – Reduces noise for more reliable support/resistance.
✅ Breakout Alerts – Built-in alerts for when price crosses the Fib level.
✅ Inverse Chart Support – Works on both regular and inverse price scales.
2. How to Use This Indicator
Primary Use Case:
Trend Retracement Entry: The 61.8% level often acts as a reversal zone in trending markets.
Breakout Confirmation: A decisive close above/below the smoothed Fib level suggests trend continuation.
Support/Resistance Flip: Watch for price reactions at this level for intraday/swing trades.
Input Parameters:
Input Default Description
Lookback Period 52 Determines how far back the highest high/lowest low is calculated. Higher = slower reaction, lower = more sensitive.
EMA Smoothing 3 Controls how much the Fib level is smoothed (higher = smoother but laggier).
Invert Price Scale Off Flips the calculation for inverse charts (e.g., for crypto perpetuals).
3. Interpretation & Trading Rules
Bullish Scenario (Buy Dips):
Price retraces to the smoothed Fib 61.8 level in an uptrend.
Confirmation: Wait for bullish candlestick patterns (hammer, engulfing) or RSI > 50.
Entry: Long on a bounce, stop-loss below recent swing low.
Bearish Scenario (Sell Rallies):
Price retraces to the smoothed Fib 61.8 level in a downtrend.
Confirmation: Bearish rejection (shooting star, bearish engulfing) or RSI < 50.
Entry: Short on rejection, stop-loss above recent swing high.
Breakout Trading:
If price closes decisively above/below the smoothed Fib level, it may signal trend continuation.
Volume & Momentum Confirmation: Use with MACD/RSI for stronger signals.
4. Best Confluence Indicators
This indicator works best when combined with:
A. Momentum Oscillators
RSI (14):
Look for oversold (RSI < 30) near Fib support in uptrends.
Look for overbought (RSI > 70) near Fib resistance in downtrends.
MACD:
Bullish: MACD crossing above signal line near Fib support.
Bearish: MACD crossing below signal line near Fib resistance.
B. Volume Analysis
Volume Spike + Fib Bounce = Strong Reversal Signal
Low Volume at Fib Retest = Potential Fakeout
C. Moving Averages
50 EMA/200 EMA Alignment:
If price is above 200 EMA and retests Fib 61.8, it’s a high-probability long.
If price is below 200 EMA and rejects Fib 61.8, it’s a high-probability short.
D. Price Action Patterns
Engulfing, Pin Bars, Inside Bars at the Fib level add confirmation.
5. Example Strategy
Setup:
Trend Identification – Price is above 200 EMA (uptrend).
Retracement to Smoothed Fib 61.8 – Price pulls back to the dynamic level.
Confirmation – Bullish hammer forms + RSI > 50.
Entry – Buy with stop below recent swing low.
Target – Previous high or 1.618 Fib extension.
6. Limitations & Adjustments
Choppy Markets: The Fib level may give false signals (use ATR filter).
Optimal Period Adjustment:
For day trading, reduce Lookback Period (e.g., 20-30).
For swing trading, increase (e.g., 50-100).
EMA Smoothing: If too slow, increase smoothing to 5-10.
Final Thoughts
This indicator is best used as a dynamic support/resistance tool rather than a standalone system. Combining it with momentum filters, volume, and price action significantly improves accuracy.
1. Overview
This indicator plots a dynamic 61.8% Fibonacci retracement level, adjusted for market volatility and smoothed using an EMA for cleaner signals. Unlike traditional static Fib levels, this version auto-adjusts based on recent price swings, making it more responsive to changing market conditions.
Key Features:
✅ Auto-Adjusting 61.8% Fib Level – Adapts to the highest high/lowest low over a user-defined period.
✅ EMA Smoothing – Reduces noise for more reliable support/resistance.
✅ Breakout Alerts – Built-in alerts for when price crosses the Fib level.
✅ Inverse Chart Support – Works on both regular and inverse price scales.
2. How to Use This Indicator
Primary Use Case:
Trend Retracement Entry: The 61.8% level often acts as a reversal zone in trending markets.
Breakout Confirmation: A decisive close above/below the smoothed Fib level suggests trend continuation.
Support/Resistance Flip: Watch for price reactions at this level for intraday/swing trades.
Input Parameters:
Input Default Description
Lookback Period 52 Determines how far back the highest high/lowest low is calculated. Higher = slower reaction, lower = more sensitive.
EMA Smoothing 3 Controls how much the Fib level is smoothed (higher = smoother but laggier).
Invert Price Scale Off Flips the calculation for inverse charts (e.g., for crypto perpetuals).
3. Interpretation & Trading Rules
Bullish Scenario (Buy Dips):
Price retraces to the smoothed Fib 61.8 level in an uptrend.
Confirmation: Wait for bullish candlestick patterns (hammer, engulfing) or RSI > 50.
Entry: Long on a bounce, stop-loss below recent swing low.
Bearish Scenario (Sell Rallies):
Price retraces to the smoothed Fib 61.8 level in a downtrend.
Confirmation: Bearish rejection (shooting star, bearish engulfing) or RSI < 50.
Entry: Short on rejection, stop-loss above recent swing high.
Breakout Trading:
If price closes decisively above/below the smoothed Fib level, it may signal trend continuation.
Volume & Momentum Confirmation: Use with MACD/RSI for stronger signals.
4. Best Confluence Indicators
This indicator works best when combined with:
A. Momentum Oscillators
RSI (14):
Look for oversold (RSI < 30) near Fib support in uptrends.
Look for overbought (RSI > 70) near Fib resistance in downtrends.
MACD:
Bullish: MACD crossing above signal line near Fib support.
Bearish: MACD crossing below signal line near Fib resistance.
B. Volume Analysis
Volume Spike + Fib Bounce = Strong Reversal Signal
Low Volume at Fib Retest = Potential Fakeout
C. Moving Averages
50 EMA/200 EMA Alignment:
If price is above 200 EMA and retests Fib 61.8, it’s a high-probability long.
If price is below 200 EMA and rejects Fib 61.8, it’s a high-probability short.
D. Price Action Patterns
Engulfing, Pin Bars, Inside Bars at the Fib level add confirmation.
5. Example Strategy
Setup:
Trend Identification – Price is above 200 EMA (uptrend).
Retracement to Smoothed Fib 61.8 – Price pulls back to the dynamic level.
Confirmation – Bullish hammer forms + RSI > 50.
Entry – Buy with stop below recent swing low.
Target – Previous high or 1.618 Fib extension.
6. Limitations & Adjustments
Choppy Markets: The Fib level may give false signals (use ATR filter).
Optimal Period Adjustment:
For day trading, reduce Lookback Period (e.g., 20-30).
For swing trading, increase (e.g., 50-100).
EMA Smoothing: If too slow, increase smoothing to 5-10.
Final Thoughts
This indicator is best used as a dynamic support/resistance tool rather than a standalone system. Combining it with momentum filters, volume, and price action significantly improves accuracy.
Korumalı komut dosyası
Bu komut dosyası kapalı kaynak olarak yayınlanmaktadır. Ancak, ücretsiz ve herhangi bir sınırlama olmaksızın kullanabilirsiniz – daha fazla bilgiyi buradan edinebilirsiniz.
Feragatname
Bilgiler ve yayınlar, TradingView tarafından sağlanan veya onaylanan finansal, yatırım, alım satım veya diğer türden tavsiye veya öneriler anlamına gelmez ve teşkil etmez. Kullanım Koşulları bölümünde daha fazlasını okuyun.