PROTECTED SOURCE SCRIPT
Güncellendi Adaptive RSI Bands
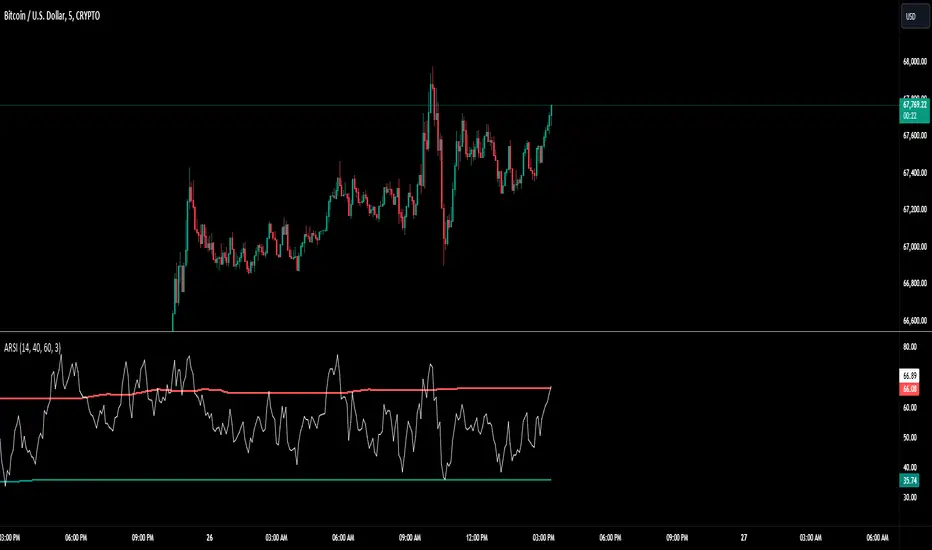
The RSI Band Optimizer is an innovative technical analysis tool designed to identify and display the most effective Relative Strength Index (RSI) band values for any given trading instrument. This powerful indicator dynamically calculates optimal overbought and oversold levels, moving beyond the traditional static 70/30 or 80/20 bands.
Core Functionality:
Dynamic RSI Band Calculation:
The indicator analyzes historical price data to determine the most effective RSI levels for identifying overbought and oversold conditions specific to the current trading instrument and timeframe.
Adaptive Optimization:
Rather than relying on external factors, the tool uses a proprietary algorithm that focuses solely on the relationship between historical RSI values and subsequent price movements. This pure RSI-based approach ensures that the bands are optimized for the indicator's own dynamics.
Continuous Recalibration:
The optimal RSI bands are continuously recalculated as new price data becomes available, ensuring that the indicator adapts to changing market conditions and remains relevant over time.
Key Inputs:
RSI Length:
Allows users to set the period for the RSI calculation. While the default is typically 14, users can adjust this to suit their trading style and the characteristics of the instrument they're trading.
Optimization Lookback:
Defines the historical period the indicator uses to calculate optimal bands. This balance between recent market behavior and longer-term patterns.
Band Sensitivity:
Enables fine-tuning of how aggressively the indicator adjusts the RSI bands. Higher sensitivity results in more frequent band adjustments, while lower sensitivity provides more stable levels.
What Makes It Unique:
Self-Contained Optimization:
Unlike indicators that rely on external data sources or comparisons, this tool focuses purely on optimizing RSI bands based on the indicator's own historical performance.
Instrument-Specific Bands:
By calculating optimal bands for each specific instrument, the indicator acknowledges that different assets may have different typical RSI ranges and behaviors.
Timeframe Adaptability:
The optimization process adapts to the selected timeframe, recognizing that optimal RSI bands may differ between short-term and long-term charts.
Dynamic Band Adjustment:
The continuous recalibration of bands allows the indicator to adapt to changing market volatility and trends, providing more relevant signals over time.
Enhanced RSI Interpretation:
By providing optimized, asset-specific overbought and oversold levels, the indicator offers a more nuanced and potentially more accurate interpretation of RSI values.
The RSI Band Optimizer represents a significant advancement in the application of the Relative Strength Index. By dynamically calculating optimal band values, it addresses one of the main criticisms of traditional RSI usage – the reliance on static, one-size-fits-all overbought and oversold levels. This tool empowers traders to make more informed decisions based on RSI readings that are truly tailored to the specific characteristics of the asset they're trading.
Sürüm Notları
Updated chart imageSürüm Notları
New calculation method with ability to weed out values that don't actually workKorumalı komut dosyası
Bu komut dosyası kapalı kaynak olarak yayınlanmaktadır. Ancak, ücretsiz ve herhangi bir sınırlama olmaksızın kullanabilirsiniz – daha fazla bilgiyi buradan edinebilirsiniz.
Feragatname
Bilgiler ve yayınlar, TradingView tarafından sağlanan veya onaylanan finansal, yatırım, alım satım veya diğer türden tavsiye veya öneriler anlamına gelmez ve teşkil etmez. Kullanım Koşulları bölümünde daha fazlasını okuyun.
Korumalı komut dosyası
Bu komut dosyası kapalı kaynak olarak yayınlanmaktadır. Ancak, ücretsiz ve herhangi bir sınırlama olmaksızın kullanabilirsiniz – daha fazla bilgiyi buradan edinebilirsiniz.
Feragatname
Bilgiler ve yayınlar, TradingView tarafından sağlanan veya onaylanan finansal, yatırım, alım satım veya diğer türden tavsiye veya öneriler anlamına gelmez ve teşkil etmez. Kullanım Koşulları bölümünde daha fazlasını okuyun.