OPEN-SOURCE SCRIPT
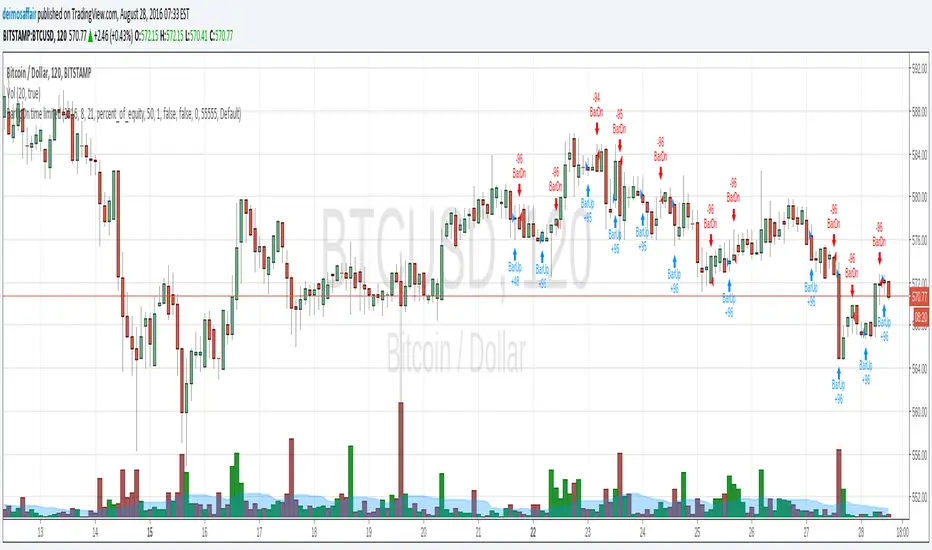
BarUpDn time limited
trying to understand strategies, it appears that there is a lot of black magic in how a strat works behind the scenes.
anyway, it's hard to analyse what's all the data with one gazillion entries, and i wanted to know how we can manipulate/do stuff with a chart.
so, i needed to know how to "give" the script my values to work on. bundled two wants/needs into one, and created a script that only applies a strategy from the date given onwards.
how to use:
at the chart, go to the "format" little button, then the input tab, and there is all the date fields i created. fun to set it to the current date, then start going backwards and see all the little arrows filing up the chart :)
Açık kaynak kodlu komut dosyası
Gerçek TradingView ruhuna uygun olarak, bu komut dosyasının oluşturucusu bunu açık kaynaklı hale getirmiştir, böylece yatırımcılar betiğin işlevselliğini inceleyip doğrulayabilir. Yazara saygı! Ücretsiz olarak kullanabilirsiniz, ancak kodu yeniden yayınlamanın Site Kurallarımıza tabi olduğunu unutmayın.
Feragatname
Bilgiler ve yayınlar, TradingView tarafından sağlanan veya onaylanan finansal, yatırım, işlem veya diğer türden tavsiye veya tavsiyeler anlamına gelmez ve teşkil etmez. Kullanım Şartları'nda daha fazlasını okuyun.