OPEN-SOURCE SCRIPT
Stocks Advance/Decline Histogram
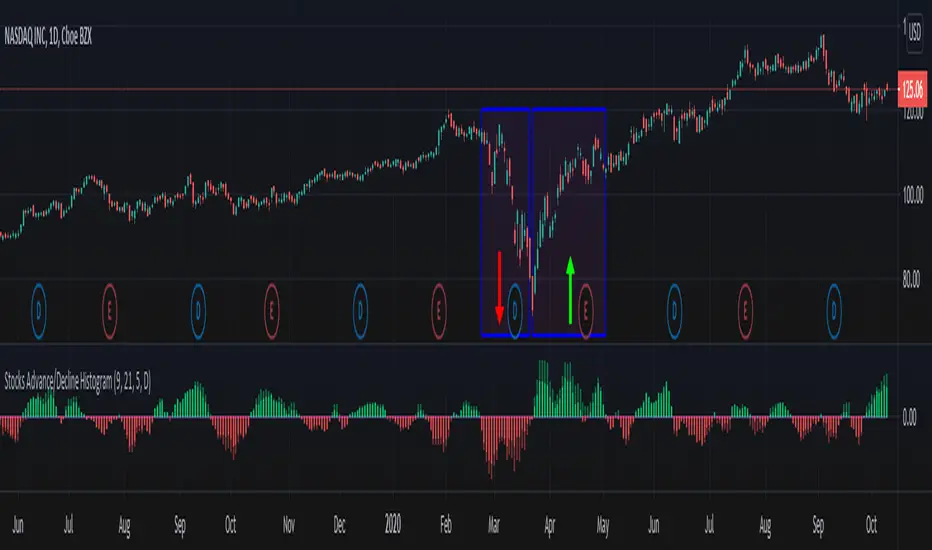
Stocks Advance/Decline Histogram indicator, which I call ADH is my own implementation that plots an histogram of the difference between the number of advancing and declining stocks on a daily basis (or higher time frame) for the NASDAQ and NYSE.
How to use it?
Green: More NYSE stocks are advancing than declining.
Red: More NYSE stocks are declining than advancing.
Light Green: More NASDAQ stocks are advancing than declining.
Light Red: More NASDAQ stocks are declining than advancing.
Note: Advance/Decline data is based on daily or higher time frames.
Açık kaynak kodlu komut dosyası
Gerçek TradingView ruhuyla, bu komut dosyasının mimarı, yatırımcıların işlevselliğini inceleyip doğrulayabilmesi için onu açık kaynaklı hale getirdi. Yazarı tebrik ederiz! Ücretsiz olarak kullanabilseniz de, kodu yeniden yayınlamanın Topluluk Kurallarımıza tabi olduğunu unutmayın.
Appreciation of my work: paypal.me/dman103
All Premium indicators: algo.win
LIVE Stream - Pivot Points Algo: youtube.com/channel/UCFyqab-i0xb2jf-c18ufH0A/live
All Premium indicators: algo.win
LIVE Stream - Pivot Points Algo: youtube.com/channel/UCFyqab-i0xb2jf-c18ufH0A/live
Feragatname
Bilgiler ve yayınlar, TradingView tarafından sağlanan veya onaylanan finansal, yatırım, alım satım veya diğer türden tavsiye veya öneriler anlamına gelmez ve teşkil etmez. Kullanım Koşulları bölümünde daha fazlasını okuyun.