OPEN-SOURCE SCRIPT
🔥 MomentumWave HA Trend
1. Heikin Ashi Candles
The indicator calculates Heikin Ashi candles to smooth price movements.
Heikin Ashi reduces market noise, making it easier to spot trends than regular candlesticks.
Bullish candle: close > open → green-ish candle.
Bearish candle: close < open → red-ish candle.
2. Exponential Moving Averages (EMA)
Two EMAs are plotted on the chart: fast EMA and slow EMA.
Fast EMA: reacts quickly to recent price changes.
Slow EMA: shows the overall trend.
When fast EMA > slow EMA → market is trending up.
When fast EMA < slow EMA → market is trending down.
3. Momentum Filters
EMA slope: the indicator checks if the fast EMA is rising or falling to confirm momentum.
ROC (Rate of Change): ensures price movement is strong in the current direction.
RSI filter: prevents signals when the market is overbought or oversold.
RSI above lower bound → allows bullish trend.
RSI below upper bound → allows bearish trend.
4. Optional MACD Filter
If enabled, the indicator uses the MACD slope to confirm trend strength.
This reduces false signals in weak trend periods.
5. Confirmation of Consecutive Candles
The indicator requires a certain number of consecutive Heikin Ashi candles in the same direction before generating a signal.
This avoids acting on a single volatile candle and increases accuracy.
6. Cooldown Period
After a signal is generated, a cooldown period prevents immediate repeated signals.
This reduces overtrading in volatile markets.
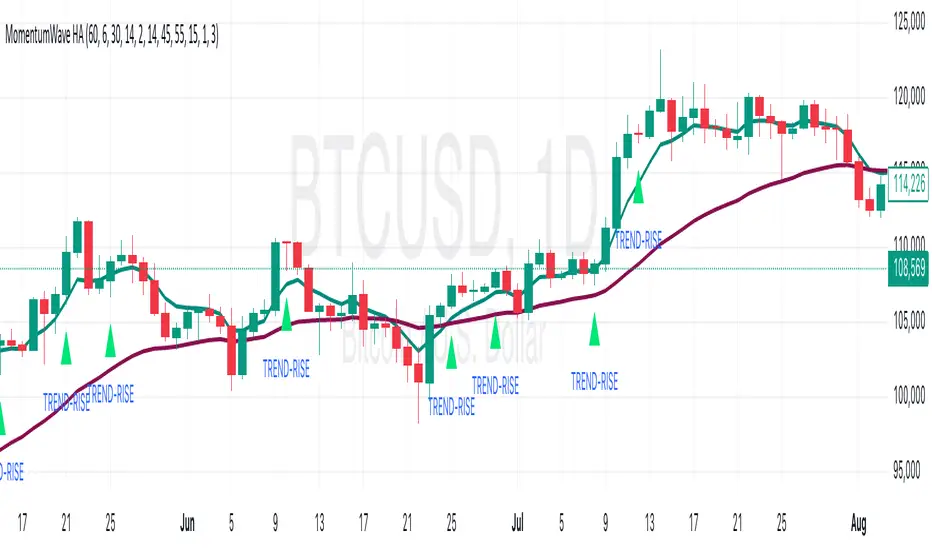
7. Signals
TREND-RISE (triangle below candle): indicates a confirmed bullish trend.
TREND-FALL (triangle above candle): indicates a confirmed bearish trend.
Alerts can be set for both signals to notify you in real time.
8. How to Use
Open a chart and add the MomentumWave HA Trend indicator.
Look at the EMA fast (teal) and EMA slow (maroon) lines.
Wait for a signal:
TREND-RISE: consider long positions or buying opportunities.
TREND-FALL: consider short positions or selling opportunities.
Check RSI and MACD (if enabled) to confirm signal strength.
Observe consecutive Heikin Ashi candle confirmation.
Respect the cooldown period before opening another position.
Apply risk management (stop-loss, position size) based on your strategy.
9. Disclaimer
This indicator is a technical analysis tool and does not guarantee profits.
Always use proper risk management and validate signals with your own analysis before trading.
The indicator calculates Heikin Ashi candles to smooth price movements.
Heikin Ashi reduces market noise, making it easier to spot trends than regular candlesticks.
Bullish candle: close > open → green-ish candle.
Bearish candle: close < open → red-ish candle.
2. Exponential Moving Averages (EMA)
Two EMAs are plotted on the chart: fast EMA and slow EMA.
Fast EMA: reacts quickly to recent price changes.
Slow EMA: shows the overall trend.
When fast EMA > slow EMA → market is trending up.
When fast EMA < slow EMA → market is trending down.
3. Momentum Filters
EMA slope: the indicator checks if the fast EMA is rising or falling to confirm momentum.
ROC (Rate of Change): ensures price movement is strong in the current direction.
RSI filter: prevents signals when the market is overbought or oversold.
RSI above lower bound → allows bullish trend.
RSI below upper bound → allows bearish trend.
4. Optional MACD Filter
If enabled, the indicator uses the MACD slope to confirm trend strength.
This reduces false signals in weak trend periods.
5. Confirmation of Consecutive Candles
The indicator requires a certain number of consecutive Heikin Ashi candles in the same direction before generating a signal.
This avoids acting on a single volatile candle and increases accuracy.
6. Cooldown Period
After a signal is generated, a cooldown period prevents immediate repeated signals.
This reduces overtrading in volatile markets.
7. Signals
TREND-RISE (triangle below candle): indicates a confirmed bullish trend.
TREND-FALL (triangle above candle): indicates a confirmed bearish trend.
Alerts can be set for both signals to notify you in real time.
8. How to Use
Open a chart and add the MomentumWave HA Trend indicator.
Look at the EMA fast (teal) and EMA slow (maroon) lines.
Wait for a signal:
TREND-RISE: consider long positions or buying opportunities.
TREND-FALL: consider short positions or selling opportunities.
Check RSI and MACD (if enabled) to confirm signal strength.
Observe consecutive Heikin Ashi candle confirmation.
Respect the cooldown period before opening another position.
Apply risk management (stop-loss, position size) based on your strategy.
9. Disclaimer
This indicator is a technical analysis tool and does not guarantee profits.
Always use proper risk management and validate signals with your own analysis before trading.
Açık kaynak kodlu komut dosyası
Gerçek TradingView ruhuna uygun olarak, bu komut dosyasının oluşturucusu bunu açık kaynaklı hale getirmiştir, böylece yatırımcılar betiğin işlevselliğini inceleyip doğrulayabilir. Yazara saygı! Ücretsiz olarak kullanabilirsiniz, ancak kodu yeniden yayınlamanın Site Kurallarımıza tabi olduğunu unutmayın.
Join my trading community on Discord! 📈 Use all our indicators for FREE
discord.gg/xPEDcNEupw
discord.gg/xPEDcNEupw
Feragatname
Bilgiler ve yayınlar, TradingView tarafından sağlanan veya onaylanan finansal, yatırım, işlem veya diğer türden tavsiye veya tavsiyeler anlamına gelmez ve teşkil etmez. Kullanım Şartları'nda daha fazlasını okuyun.