OPEN-SOURCE SCRIPT
Resistances v2[UO] - Uncluttered Display
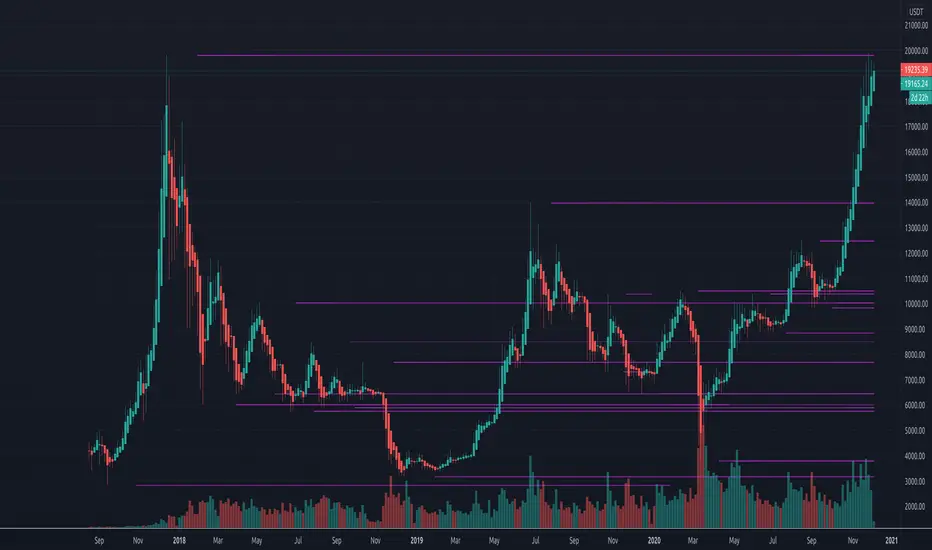
This script shows support-and-resistance levels that span months and weeks.
It also shows the levels in the last 100 bars in higher detail. Details detection is only applied to last 100 bars so that your chart is not cluttered with infinite horizontal lines. 100 can be changed in the settings.
For example, here, you see the levels in small time frames at a different detail level:
This script uses the arrays introduced in pine script v4
Açık kaynak kodlu komut dosyası
Gerçek TradingView ruhuyla, bu komut dosyasının mimarı, yatırımcıların işlevselliğini inceleyip doğrulayabilmesi için onu açık kaynaklı hale getirdi. Yazarı tebrik ederiz! Ücretsiz olarak kullanabilseniz de, kodu yeniden yayınlamanın Topluluk Kurallarımıza tabi olduğunu unutmayın.
Feragatname
Bilgiler ve yayınlar, TradingView tarafından sağlanan veya onaylanan finansal, yatırım, alım satım veya diğer türden tavsiye veya öneriler anlamına gelmez ve teşkil etmez. Kullanım Koşulları bölümünde daha fazlasını okuyun.