PROTECTED SOURCE SCRIPT
Güncellendi candleswissknife
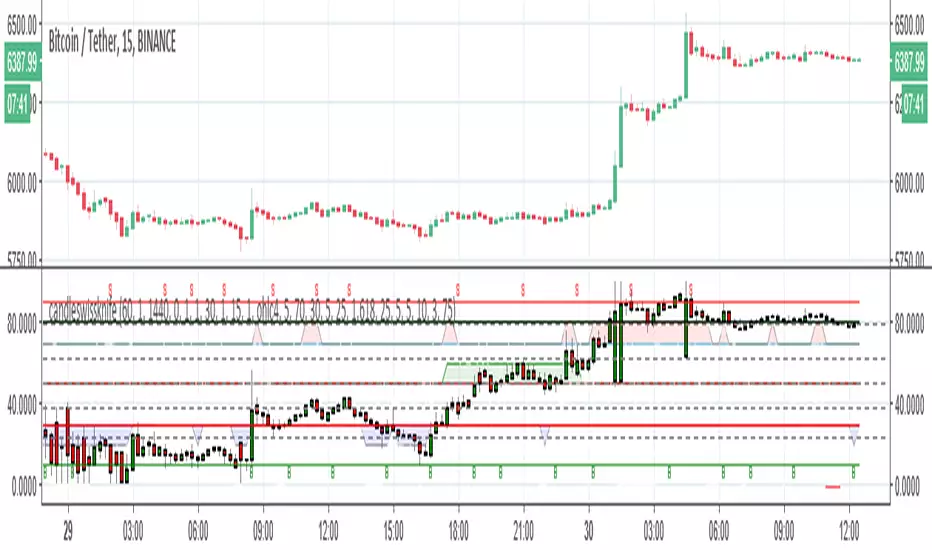
there are two system to buy and sell in this indicator
system 1 is based on long ema and short ema with heiken candle and macd filter (green=buy and red=sell) line bellow the candles)
system 2 is based on fib candle and fast rsi and fast adx crossing (blue=buy line and gray=sell line bellow candle)
B and S are points of stoch rsi crossing
inside there are points of divergence based on ATR and rsi
Sürüm Notları
add color to make it more easy to see + one more buy point that is rsi and candle dependent+ATRsystem is green and lime good strong points of buy.. blue is a potential one
red=sell.. light red you need to think if you want to sell
Sürüm Notları
add alertsSürüm Notları
just fix some issue with system 1 buy Sürüm Notları
fix issue with buy point 2Sürüm Notları
just small change in point buy 1Korumalı komut dosyası
Bu komut dosyası kapalı kaynak olarak yayınlanmaktadır. Ancak, ücretsiz ve herhangi bir sınırlama olmaksızın kullanabilirsiniz – daha fazla bilgiyi buradan edinebilirsiniz.
Feragatname
Bilgiler ve yayınlar, TradingView tarafından sağlanan veya onaylanan finansal, yatırım, alım satım veya diğer türden tavsiye veya öneriler anlamına gelmez ve teşkil etmez. Kullanım Koşulları bölümünde daha fazlasını okuyun.
Korumalı komut dosyası
Bu komut dosyası kapalı kaynak olarak yayınlanmaktadır. Ancak, ücretsiz ve herhangi bir sınırlama olmaksızın kullanabilirsiniz – daha fazla bilgiyi buradan edinebilirsiniz.
Feragatname
Bilgiler ve yayınlar, TradingView tarafından sağlanan veya onaylanan finansal, yatırım, alım satım veya diğer türden tavsiye veya öneriler anlamına gelmez ve teşkil etmez. Kullanım Koşulları bölümünde daha fazlasını okuyun.