OPEN-SOURCE SCRIPT
RSI Simple and Smooth
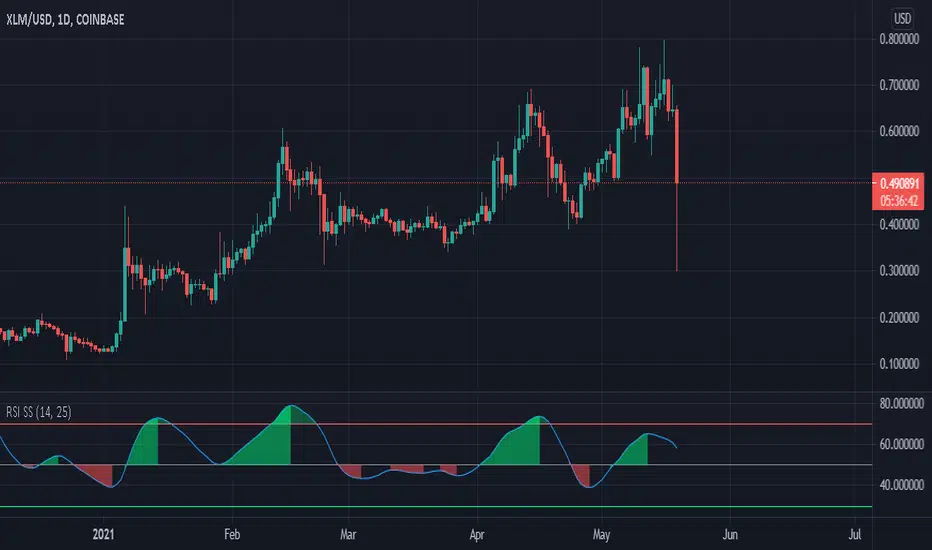
made this RSI for beginners who are annoyed by the jittery signals. Uses a HMA to smooth out the data. I made oversold line green and overbought line red where as the oscillator is green above 50 and red when below 50. This is done intentionally. This is to help remind the user that while there is a downtrend, there is a buy opportunity, and while there is a buy opportunity - there is a downtrend
On the other side, the red overbought line is to remind the user that while there is an uptrend, there is a sell opportunity, and while there is a sell opportunity - there is an uptrend :)
On the other side, the red overbought line is to remind the user that while there is an uptrend, there is a sell opportunity, and while there is a sell opportunity - there is an uptrend :)
Açık kaynak kodlu komut dosyası
Gerçek TradingView ruhuyla, bu komut dosyasının mimarı, yatırımcıların işlevselliğini inceleyip doğrulayabilmesi için onu açık kaynaklı hale getirdi. Yazarı tebrik ederiz! Ücretsiz olarak kullanabilseniz de, kodu yeniden yayınlamanın Topluluk Kurallarımıza tabi olduğunu unutmayın.
Feragatname
Bilgiler ve yayınlar, TradingView tarafından sağlanan veya onaylanan finansal, yatırım, alım satım veya diğer türden tavsiye veya öneriler anlamına gelmez ve teşkil etmez. Kullanım Koşulları bölümünde daha fazlasını okuyun.