OPEN-SOURCE SCRIPT
Frog in Pan Indicator
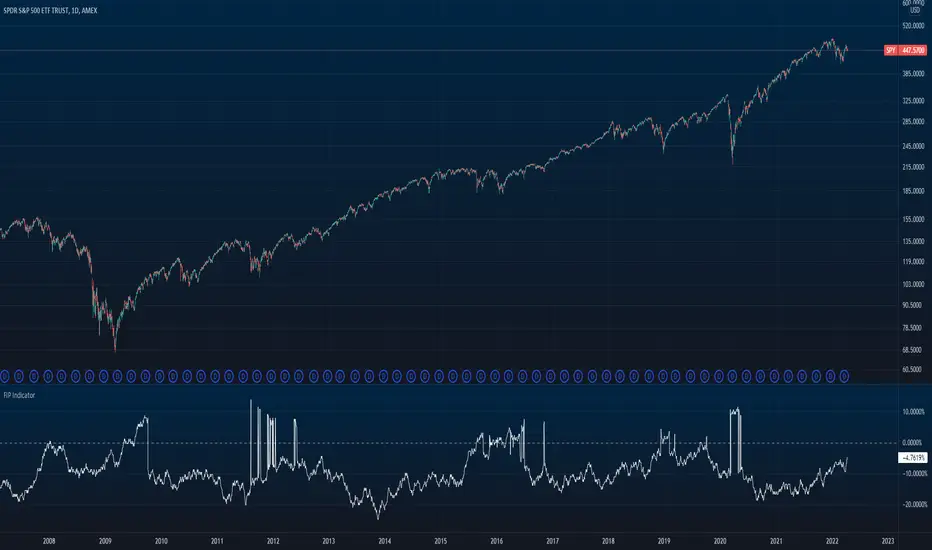
What is it?
This indicator is the percent of negative days minus the percent of positive days in a year multiplied by the sign of the overall return of the lookback (365 days for crypto and 252 days for stocks).
FIP = sign(return of lookback) * [% negative - % positive]
What is it used for?
This indicator is used as a quality screener for momentum stocks. It is based behind the ideas in Wesley Gray & Jack Vogel's book: Quantitative Momentum: A Practitioner's Guide to Building a Momentum-Based Stock Selection System that iterates that quality momentum stocks consist of steady uptrends (where more days are positive rather than negative) as opposed to characteristics of "lottery-like" stocks that are "jumpy" and more volatile. More research behind this indicator can be found here
How to use
In the indicator settings, the default lookback parameter is set to 365 days for analysis on cryptocurrencies and was used on a daily timeframe. If you want to use this indicator on individual stocks, it is best to change this lookback to 252 days. The more negative the value is, the higher quality of momentum it is.
Açık kaynak kodlu komut dosyası
Gerçek TradingView ruhuyla, bu komut dosyasının mimarı, yatırımcıların işlevselliğini inceleyip doğrulayabilmesi için onu açık kaynaklı hale getirdi. Yazarı tebrik ederiz! Ücretsiz olarak kullanabilseniz de, kodu yeniden yayınlamanın Topluluk Kurallarımıza tabi olduğunu unutmayın.
Feragatname
Bilgiler ve yayınlar, TradingView tarafından sağlanan veya onaylanan finansal, yatırım, alım satım veya diğer türden tavsiye veya öneriler anlamına gelmez ve teşkil etmez. Kullanım Koşulları bölümünde daha fazlasını okuyun.