OPEN-SOURCE SCRIPT
Bollinger Bands (with Width/GaUGE)
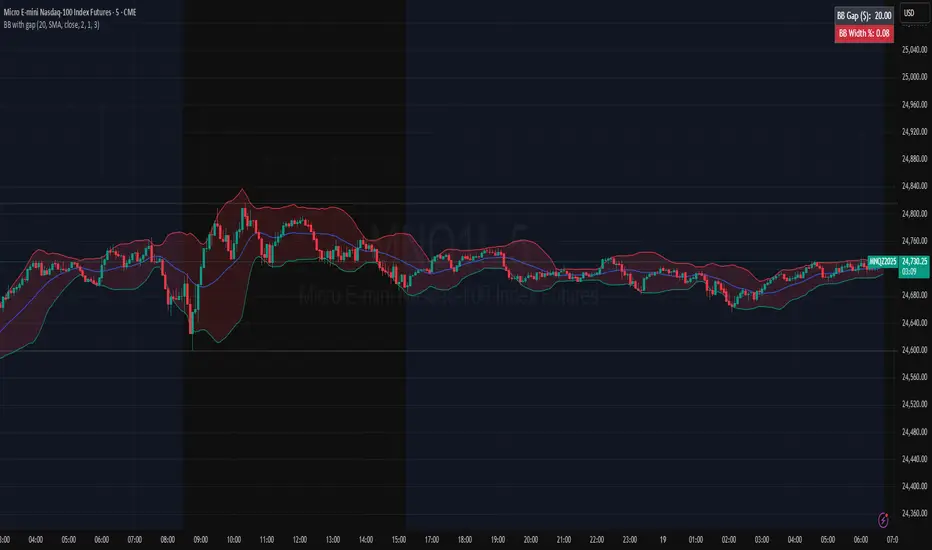
This overlay plots standard Bollinger Bands and makes volatility obvious. The fill between bands is color-coded by band width (tight = red “squeeze”, wide = teal “expansion”, mid = yellow). A compact table (top-right) shows live BB Gap ($) and BB Width (%), and the width also appears in the status line. Thresholds for squeeze/expansion are user-set. Use it to avoid low-volatility chop and time breakouts when width expands.
Açık kaynak kodlu komut dosyası
Gerçek TradingView ruhuna uygun olarak, bu komut dosyasının oluşturucusu bunu açık kaynaklı hale getirmiştir, böylece yatırımcılar betiğin işlevselliğini inceleyip doğrulayabilir. Yazara saygı! Ücretsiz olarak kullanabilirsiniz, ancak kodu yeniden yayınlamanın Site Kurallarımıza tabi olduğunu unutmayın.
Feragatname
Bilgiler ve yayınlar, TradingView tarafından sağlanan veya onaylanan finansal, yatırım, işlem veya diğer türden tavsiye veya tavsiyeler anlamına gelmez ve teşkil etmez. Kullanım Şartları'nda daha fazlasını okuyun.