OPEN-SOURCE SCRIPT
Güncellendi Brian Shannon 5-Day MA Background
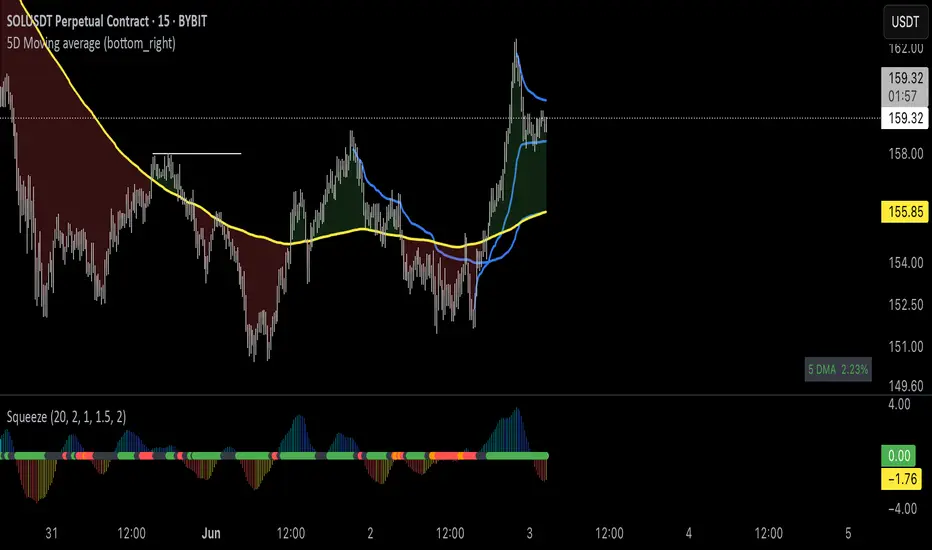
Brian Shannon 5-Day Moving Average with Dynamic Background Fill
OVERVIEW
This indicator implements Brian Shannon's renowned 5-Day Moving Average methodology from his acclaimed work "Technical Analysis Using Multiple Timeframes." The indicator provides instant visual clarity on short-term trend direction and momentum, making it an essential tool for swing traders and active investors.
KEY FEATURES
• True 5-Day Moving Average: Dynamically calculates the correct period across all timeframes (1min, 5min, 15min, 1H, etc.)
• Visual Price-to-MA Relationship: Color-coded fill between price and the moving average
- Green Fill: Price is above the 5-day MA (bullish short-term momentum)
- Red Fill: Price is below the 5-day MA (bearish short-term momentum)
• Multi-Timeframe Compatible: Works seamlessly on any chart timeframe while maintaining the true 5-day calculation
BRIAN SHANNON'S STRATEGIC APPLICATION
Primary Uses:
1. Trend Identification: Quickly identify short-term momentum shifts
2. Dynamic Support/Resistance: The 5-day MA acts as a moving support level in uptrends and resistance in downtrends
3. Entry Signal Confirmation: Look for pullbacks to the 5-day MA as potential entry points in trending stocks
4. Multi-Timeframe Analysis: Essential component of Shannon's multiple timeframe approach
Perfect Combination with:
• AVWAP (Anchored Volume Weighted Average Price): Use together to identify high-probability setups where price is above both the 5-day MA and AVWAP
• Longer-term Moving Averages: Combine with 20-day and 50-day MAs for complete trend analysis
• Volume Analysis: Confirm 5-day MA signals with volume patterns
TRADING APPLICATIONS
For Swing Traders:
• Bullish Setup: Price above 5-day MA + above AVWAP + above longer-term MAs = Strong uptrend
• Bearish Setup: Price below 5-day MA + below AVWAP + below longer-term MAs = Strong downtrend
• Entry Timing: Use pullbacks to the 5-day MA as entry opportunities in the direction of the primary trend
For Day Traders:
• Quick visual confirmation of intraday momentum
• Dynamic support/resistance levels for scalping opportunities
• Clear trend bias for directional trades
WHY THIS INDICATOR WORKS
Brian Shannon's approach emphasizes that the 5-day moving average represents the short-term sentiment of market participants. When price is consistently above this level, it indicates buyers are in control of short-term price action. Conversely, when price falls below, it suggests selling pressure is dominating.
The visual fill makes it immediately obvious:
• How far price is from the 5-day MA
• The strength of the current short-term trend
• Potential areas where price might find support or resistance
BEST PRACTICES
1. Never use in isolation - Always combine with longer timeframe analysis
2. Volume confirmation - Look for volume expansion on moves away from the 5-day MA
3. Multiple timeframe approach - Check higher timeframes for overall trend direction
4. Combine with AVWAP - Most powerful when both indicators align
INSTALLATION NOTES
This indicator automatically adjusts for any timeframe, ensuring you always get a true 5-trading-day moving average regardless of whether you're viewing 1-minute or hourly charts.
Based on the technical analysis methodology of Brian Shannon, author of "Technical Analysis Using Multiple Timeframes"
Sürüm Notları
Updated that it will be seamless in the daily chart as wellSürüm Notları
Update:1. Added a label to indicate how far the price from the 5 day moving average
Sürüm Notları
Update:1. Rename the title
Açık kaynak kodlu komut dosyası
Gerçek TradingView ruhuyla, bu komut dosyasının yaratıcısı, yatırımcıların işlevselliğini inceleyip doğrulayabilmesi için onu açık kaynaklı hale getirdi. Yazarı tebrik ederiz! Ücretsiz olarak kullanabilseniz de, kodu yeniden yayınlamanın Topluluk Kurallarımıza tabi olduğunu unutmayın.
Feragatname
Bilgiler ve yayınlar, TradingView tarafından sağlanan veya onaylanan finansal, yatırım, alım satım veya diğer türden tavsiye veya öneriler anlamına gelmez ve teşkil etmez. Kullanım Koşulları bölümünde daha fazlasını okuyun.