OPEN-SOURCE SCRIPT
Güncellendi Draw Several Horizontal Lines [MsF]
Japanese below / 日本語説明は英文の後にあります。
-------------------------
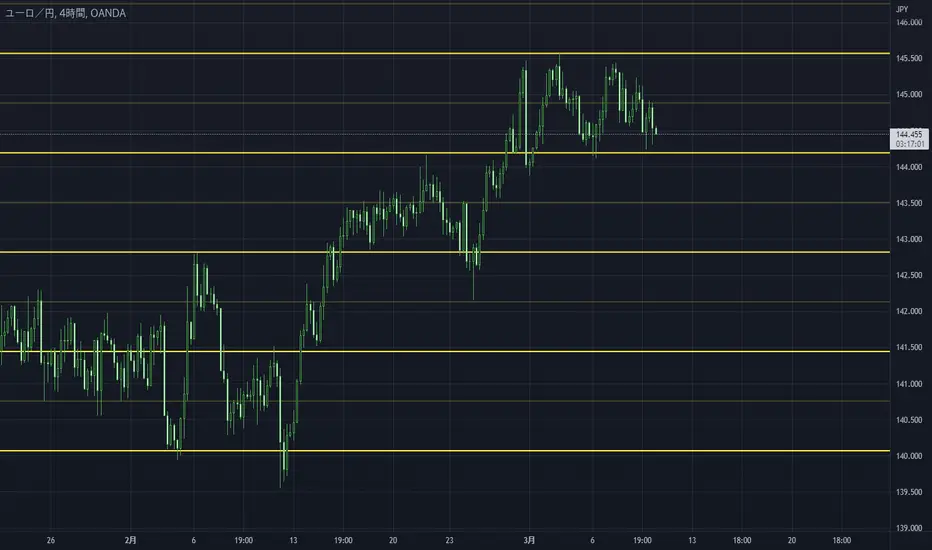
This indicator that automatically draws a horizontal line by copying from the input High/Low. Useful for doing horizon analysis. It's possible to display Fibonacci based on the entered High/Low. You can get the alert of each Fibonacci point.
- Parameter
Input Upper Value: Enter the High value
Input Lower Value: Enter the Low value
Band Range Count : Enter the number of horizontal lines
Fibonacci : visible or invisible
-------------------------
入力したHigh/Lowを起点に水平線を上下にコピーして自動で描画するインジケーターです。水平線分析を行うのに役立ちます。
また、入力したHigh/Lowを元にfibonacciを表示することも可能です。fibonacciについては、各ポイント毎にアラートの設定も可能です。
<パラメータ説明>
Input Upper Value:起点となるHighを入力してください
Input Lower Value:起点となるLowを入力してください
Band Range Count :水平線を上下にコピーする本数を入力してください
Fibonacci :フィボナッチが不要な場合はfalseにしてください
-------------------------
This indicator that automatically draws a horizontal line by copying from the input High/Low. Useful for doing horizon analysis. It's possible to display Fibonacci based on the entered High/Low. You can get the alert of each Fibonacci point.
- Parameter
Input Upper Value: Enter the High value
Input Lower Value: Enter the Low value
Band Range Count : Enter the number of horizontal lines
Fibonacci : visible or invisible
-------------------------
入力したHigh/Lowを起点に水平線を上下にコピーして自動で描画するインジケーターです。水平線分析を行うのに役立ちます。
また、入力したHigh/Lowを元にfibonacciを表示することも可能です。fibonacciについては、各ポイント毎にアラートの設定も可能です。
<パラメータ説明>
Input Upper Value:起点となるHighを入力してください
Input Lower Value:起点となるLowを入力してください
Band Range Count :水平線を上下にコピーする本数を入力してください
Fibonacci :フィボナッチが不要な場合はfalseにしてください
Sürüm Notları
It doesn't support multiple currency pairs. If you want to use this indicator for multiple currency pairs, you can switch between your browser tabs.----------
複数の通貨ペアには対応しておりません。もし複数の通貨ペアにて本インジケータを使用する場合は、ブラウザのタブを切り替えることで使用することができます。
https://www.tradingview.com/x/XzllGhE5/
Sürüm Notları
It supports multiple symbols (MAX 10 symbols). Register your favorite symbol :)Notice: The Fibonacci drawing has been removed.
----------
使いづらかったので複数通貨(MAX10通貨)に対応しました。お気に入りの通貨ペアをご登録ください。
なお、代わりにフィボナッチ描画仕様は削除しました。
Sürüm Notları
Only internal logic improvedSürüm Notları
Improved that can work on ES1! or other futures.Sürüm Notları
Changed the maximum value of "Band Lines Count" to 20Açık kaynak kodlu komut dosyası
Gerçek TradingView ruhuyla, bu komut dosyasının mimarı, yatırımcıların işlevselliğini inceleyip doğrulayabilmesi için onu açık kaynaklı hale getirdi. Yazarı tebrik ederiz! Ücretsiz olarak kullanabilseniz de, kodu yeniden yayınlamanın Topluluk Kurallarımıza tabi olduğunu unutmayın.
Feragatname
Bilgiler ve yayınlar, TradingView tarafından sağlanan veya onaylanan finansal, yatırım, alım satım veya diğer türden tavsiye veya öneriler anlamına gelmez ve teşkil etmez. Kullanım Koşulları bölümünde daha fazlasını okuyun.
Açık kaynak kodlu komut dosyası
Gerçek TradingView ruhuyla, bu komut dosyasının mimarı, yatırımcıların işlevselliğini inceleyip doğrulayabilmesi için onu açık kaynaklı hale getirdi. Yazarı tebrik ederiz! Ücretsiz olarak kullanabilseniz de, kodu yeniden yayınlamanın Topluluk Kurallarımıza tabi olduğunu unutmayın.
Feragatname
Bilgiler ve yayınlar, TradingView tarafından sağlanan veya onaylanan finansal, yatırım, alım satım veya diğer türden tavsiye veya öneriler anlamına gelmez ve teşkil etmez. Kullanım Koşulları bölümünde daha fazlasını okuyun.