PROTECTED SOURCE SCRIPT
Güncellendi Daily ATR Levels - Vishal Subandh

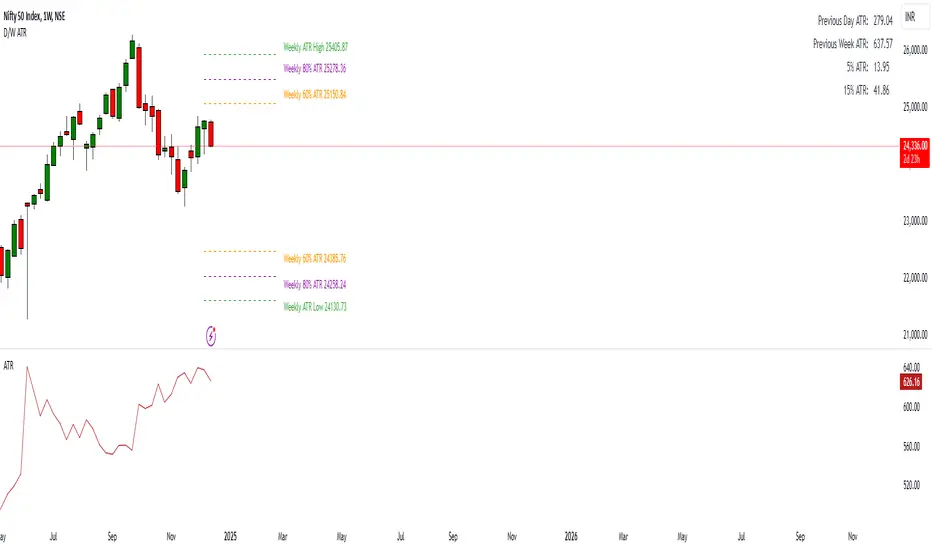
The following script visualizes the ATR High and ATR Low levels based on the previous day’s closing price. The Average True Range (ATR) indicates how much a stock is likely to move—upward or downward—on a given day, providing insight into its intraday volatility. Additionally, the script calculates and displays the daily ATR as a percentage, with specific levels marked at 60% and 80%.
These percentage levels are plotted for both the high and low ranges, offering a framework to analyze potential price movements. In the context of a strong trend, prices often extend to the 80% or even 100% ATR level before showing signs of reversal. Such behavior is observed during pronounced uptrends or downtrends. Conversely, during weaker trends, price reversals may occur at the 60% ATR levels.
It is recommended to use this analysis in conjunction with other tools, such as support and resistance levels or demand and supply zones, for a more comprehensive approach to trading.
Sürüm Notları
Added an option where the user can use 2 decimal places or 4 decimal places to see the values for forex marketsSürüm Notları
Added Weekly ATR levels for swing trading. The study will now allow the trader to view either Daily levels, Weekly Levels, or both on the charts. Using this the trader can look for a confluence of the daily and weekly levels in conjunction with support and resistance or demand and supplyKorumalı komut dosyası
Bu komut dosyası kapalı kaynak olarak yayınlanmaktadır. Ancak, ücretsiz ve herhangi bir sınırlama olmaksızın kullanabilirsiniz – daha fazla bilgiyi buradan edinebilirsiniz.
Feragatname
Bilgiler ve yayınlar, TradingView tarafından sağlanan veya onaylanan finansal, yatırım, alım satım veya diğer türden tavsiye veya öneriler anlamına gelmez ve teşkil etmez. Kullanım Koşulları bölümünde daha fazlasını okuyun.
Korumalı komut dosyası
Bu komut dosyası kapalı kaynak olarak yayınlanmaktadır. Ancak, ücretsiz ve herhangi bir sınırlama olmaksızın kullanabilirsiniz – daha fazla bilgiyi buradan edinebilirsiniz.
Feragatname
Bilgiler ve yayınlar, TradingView tarafından sağlanan veya onaylanan finansal, yatırım, alım satım veya diğer türden tavsiye veya öneriler anlamına gelmez ve teşkil etmez. Kullanım Koşulları bölümünde daha fazlasını okuyun.