OPEN-SOURCE SCRIPT
Bollinger Bands Fibonacci ratios
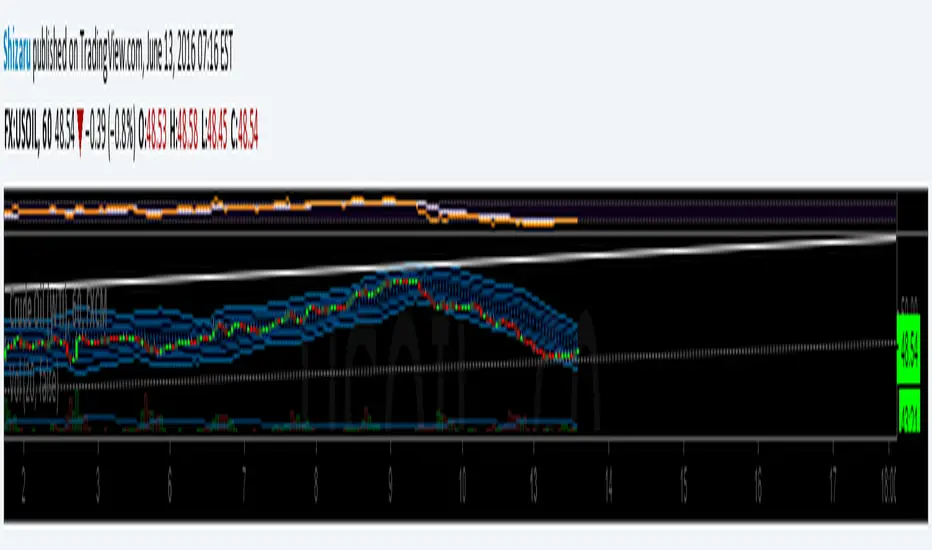
The Fibonacci Bollinger Bands indicator is based on the same principles as the standard Bollinger Bands indicator developed by John Bollinger. The Fibonacci Bollinger Bands indicator bases its upper and lower bands on volatility just like the Bollinger Bands indicator does, but instead of using standard deviation as the measure of volatility, a Wilders Smoothed ATR is used in its place.
The middle band is a moving average used to establish the intermediate-term trend. The 3 upper bands are constructed by using the Wilders Smoothed ATR and multiplying it by each of the Fibonacci factors (1.618, 2.618, and 4.236) and then adding the results to the middle band. The 3 lower bands are constructed in the same manner as the upper bands except their results are subtracted from the middle band.
The middle band is a moving average used to establish the intermediate-term trend. The 3 upper bands are constructed by using the Wilders Smoothed ATR and multiplying it by each of the Fibonacci factors (1.618, 2.618, and 4.236) and then adding the results to the middle band. The 3 lower bands are constructed in the same manner as the upper bands except their results are subtracted from the middle band.
Açık kaynak kodlu komut dosyası
Gerçek TradingView ruhuna uygun olarak, bu komut dosyasının oluşturucusu bunu açık kaynaklı hale getirmiştir, böylece yatırımcılar betiğin işlevselliğini inceleyip doğrulayabilir. Yazara saygı! Ücretsiz olarak kullanabilirsiniz, ancak kodu yeniden yayınlamanın Site Kurallarımıza tabi olduğunu unutmayın.
Feragatname
Bilgiler ve yayınlar, TradingView tarafından sağlanan veya onaylanan finansal, yatırım, işlem veya diğer türden tavsiye veya tavsiyeler anlamına gelmez ve teşkil etmez. Kullanım Şartları'nda daha fazlasını okuyun.