OPEN-SOURCE SCRIPT
Triple Weekly Moving Average
Triple Weekly Moving Average
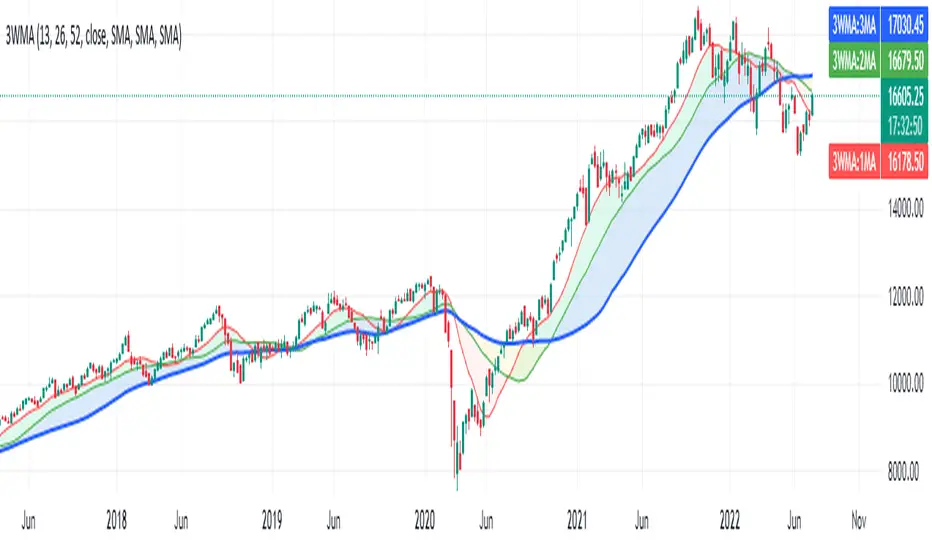
The default settings plot 3 weekly moving averages [SMA] for 13, 26 and 52 weeks, for analyzing Short (Quarterly), Medium (Semester) and long term (Yearly) view.
Idea is when the three moving averages are aligned, the security is in trend and when they crisscross the security may be either turning, slowing down or stalling, however, this must be correlated with other studies.
Started observing half yearly moving average after reading Stan Weinstein's Secrets For Profiting in Bull and Bear Markets.
The settings of the indicator are pretty self explanatory. The indicator gives an option to select lookahead, however, change it only when you are well aware of the consequences, the default setting is Turned Off, please follow TV user guide for a detailed explanation on lookahead. I added it as I was plotting this script on Daily timeframe and wanted to observe the changes.
Açık kaynak kodlu komut dosyası
Gerçek TradingView ruhuyla, bu komut dosyasının mimarı, yatırımcıların işlevselliğini inceleyip doğrulayabilmesi için onu açık kaynaklı hale getirdi. Yazarı tebrik ederiz! Ücretsiz olarak kullanabilseniz de, kodu yeniden yayınlamanın Topluluk Kurallarımıza tabi olduğunu unutmayın.
Feragatname
Bilgiler ve yayınlar, TradingView tarafından sağlanan veya onaylanan finansal, yatırım, alım satım veya diğer türden tavsiye veya öneriler anlamına gelmez ve teşkil etmez. Kullanım Koşulları bölümünde daha fazlasını okuyun.