OPEN-SOURCE SCRIPT
IMI and MFI Combined
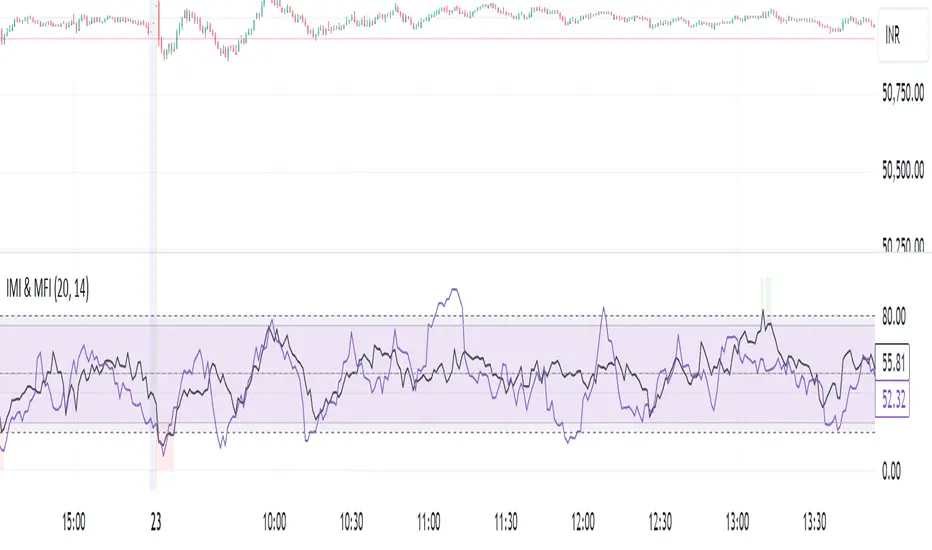
For a strategy using the combined IMI (Intraday Momentum Index), MFI (Money Flow Index), and Bollinger Bands on a 1-minute chart of Bank NIFTY (Bank Nifty Index), here's how you can interpret the indicators and define a sell signal strategy:
Strategy Explanation:
IMI (Intraday Momentum Index):
IMI measures the ratio of upward price changes to downward price changes over a specified period, indicating momentum.
In the script, IMI is plotted with a range from 0 to 100. Levels above 75 are considered overbought, and levels below 25 are oversold.
Strategy Condition: A sell signal can be considered when IMI is above 75, indicating a potentially overbought market condition.
MFI (Money Flow Index):
MFI measures the strength of money flowing in and out of a security, using price and volume.
In the script, MFI is plotted with levels at 80 (overbought) and 20 (oversold).
Strategy Condition: A sell signal can be considered when MFI is above 80, suggesting an overbought condition in the market.
Bollinger Bands:
Bollinger Bands consist of a middle band (SMA) and upper/lower bands representing volatility levels around the price.
In the script, Bollinger Bands are plotted with a length of 20 and a standard deviation multiplier of 2.
Strategy Condition: While not explicitly used for generating sell signals in this script, Bollinger Bands can help confirm price volatility and potential reversals when combined with other indicators.
Sell Signal Criteria:
IMI Sell Signal: Look for instances where IMI rises above 75. This indicates that the recent upward price momentum may be reaching an unsustainable level, potentially signaling a reversal or a pullback in prices.
MFI Sell Signal: Look for MFI rising above 80. This suggests that the market has experienced strong buying pressure, possibly leading to an overbought condition where a price correction or reversal might occur.
Implementation Considerations:
Confirmation: Consider waiting for both IMI and MFI to confirm the overbought condition simultaneously before entering a sell trade. This can increase the reliability of the signal.
Risk Management: Use stop-loss orders to manage risk in case the market moves against the anticipated direction after the sell signal is triggered.
Timeframe: This strategy is tailored for a 1-minute chart, meaning signals should be interpreted and acted upon quickly due to the rapid nature of price movements in intraday trading.
By combining these indicators and interpreting their signals, you can develop a systematic approach to identifying potential sell opportunities in the Bank NIFTY index on a 1-minute timeframe. Adjustments to indicator parameters and additional technical analysis may further refine the strategy based on your trading preferences and risk tolerance.
Açık kaynak kodlu komut dosyası
Gerçek TradingView ruhuyla, bu komut dosyasının mimarı, yatırımcıların işlevselliğini inceleyip doğrulayabilmesi için onu açık kaynaklı hale getirdi. Yazarı tebrik ederiz! Ücretsiz olarak kullanabilseniz de, kodu yeniden yayınlamanın Topluluk Kurallarımıza tabi olduğunu unutmayın.
Feragatname
Bilgiler ve yayınlar, TradingView tarafından sağlanan veya onaylanan finansal, yatırım, alım satım veya diğer türden tavsiye veya öneriler anlamına gelmez ve teşkil etmez. Kullanım Koşulları bölümünde daha fazlasını okuyun.