OPEN-SOURCE SCRIPT
Güncellendi Hybrid Trend MA
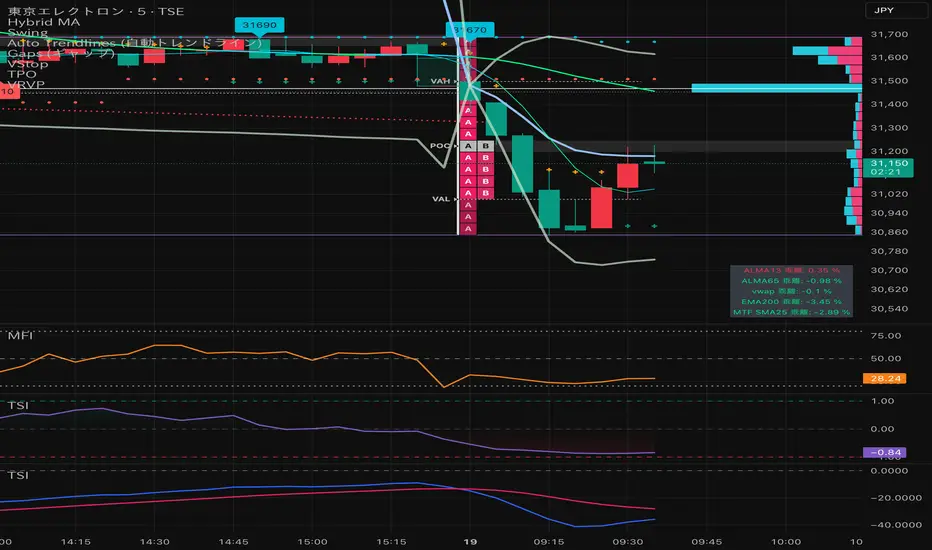
Hybrid Trend MA (Pine Script v6)
This indicator combines Exponential Moving Averages (EMA) and Arnaud Legoux Moving Averages (ALMA) into a single hybrid trend-following tool. It is designed to help traders visualize medium- and long-term trend directions while also capturing smoother short-term signals.
Key Features:
EMA Trend Structure
Three EMAs are plotted (lengths: 38, 62, 200).
Each EMA line changes color depending on whether it is rising or falling relative to the others:
Red → Strong uptrend alignment.
Lime → Strong downtrend alignment.
Aqua → Neutral or transition.
The indicator also fills the space between EMA zones with silver shading to highlight trend channels.
ALMA Trend Confirmation
Two ALMA curves are plotted (lengths: 13, 50).
Similar rising/falling logic is applied to color them:
Red → Bullish alignment and rising.
Green → Bearish alignment and falling.
Cyan → Neutral or uncertain trend.
A cross marker is plotted whenever the fast and slow ALMA lines cross, which may serve as an entry/exit confirmation.
Customizable Smoothing
The smoothe setting controls how many bars are checked to confirm whether an EMA or ALMA is rising/falling, helping reduce noise.
How to Use:
Trend Identification: The EMA set shows the larger market structure. When all EMAs align in direction and color, the trend is stronger.
Entry & Exit Confirmation: The ALMA cross signals can be used to refine entries and exits within the broader EMA trend.
Dynamic Visuals: Colored EMAs + ALMAs make it easy to distinguish bullish, bearish, and ranging conditions at a glance.
Sürüm Notları
Add VWAPAçık kaynak kodlu komut dosyası
Gerçek TradingView ruhuyla, bu komut dosyasının mimarı, yatırımcıların işlevselliğini inceleyip doğrulayabilmesi için onu açık kaynaklı hale getirdi. Yazarı tebrik ederiz! Ücretsiz olarak kullanabilseniz de, kodu yeniden yayınlamanın Topluluk Kurallarımıza tabi olduğunu unutmayın.
Feragatname
Bilgiler ve yayınlar, TradingView tarafından sağlanan veya onaylanan finansal, yatırım, alım satım veya diğer türden tavsiye veya öneriler anlamına gelmez ve teşkil etmez. Kullanım Koşulları bölümünde daha fazlasını okuyun.
Açık kaynak kodlu komut dosyası
Gerçek TradingView ruhuyla, bu komut dosyasının mimarı, yatırımcıların işlevselliğini inceleyip doğrulayabilmesi için onu açık kaynaklı hale getirdi. Yazarı tebrik ederiz! Ücretsiz olarak kullanabilseniz de, kodu yeniden yayınlamanın Topluluk Kurallarımıza tabi olduğunu unutmayın.
Feragatname
Bilgiler ve yayınlar, TradingView tarafından sağlanan veya onaylanan finansal, yatırım, alım satım veya diğer türden tavsiye veya öneriler anlamına gelmez ve teşkil etmez. Kullanım Koşulları bölümünde daha fazlasını okuyun.