OPEN-SOURCE SCRIPT
Price–MA Separation (Z-Score)
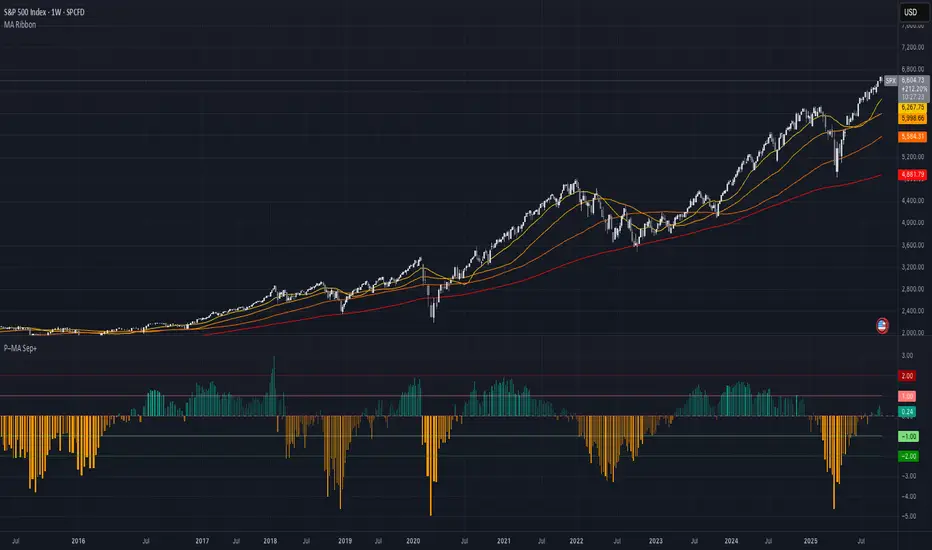
Price–MA Separation (Z-Score + Shading)
This indicator measures how far price is from a chosen moving average and shows it in a separate pane.
It helps traders quickly spot overextended moves and mean-reversion opportunities.
⸻
What it does
• Calculates the separation between price and a moving average (MA):
• In Points (Price − MA)
• In Percent ((Price / MA − 1) × 100%)
• Converts that separation into a Z-Score (statistical measure of deviation):
• Z = (Separation − Mean) ÷ StdDev
• Highlights when price is unusually far from the MA relative to its recent history.
⸻
Visuals
• Histogram bars:
• Green = above the MA,
• Orange = below the MA.
• Intensity increases with larger Z-Scores.
• Zero line: red baseline (price = MA).
• Z threshold lines:
• +T1 = light red (mild overbought)
• +T2 = dark red (strong overbought)
• −T1 = light green (mild oversold)
• −T2 = dark green (strong oversold)
• Default thresholds: ±1 and ±2.
⸻
Settings
• MA Type & Length: Choose between SMA, EMA, WMA, VWMA, or SMMA (RMA).
• Units: Show separation in Points or Percent.
• Plot Mode:
• Raw = distance in points/percent.
• Z-Score = standardized deviation (default).
• Absolute Mode: Show only magnitude (ignore direction).
• Smoothing: Overlay a smoothed line on the histogram.
• Z-Bands: Visual guides at ± thresholds.
⸻
How to use
• Look for large positive Z-Scores (red zones): price may be stretched far above its MA.
• Look for large negative Z-Scores (green zones): price may be stretched far below its MA.
• Use as a mean-reversion signal or to confirm trend exhaustion.
• Works well with:
• Swing entries/exits
• Overbought/oversold conditions
• Filtering other signals (RSI, MACD, VWAP)
⸻
Notes
• Z-Scores depend on the lookback window (default = 100 bars). Adjust for shorter/longer memory.
• Strong deviations don’t always mean reversal—combine with other tools for confirmation.
• Not financial advice. Always manage risk.
⸻
Try adjusting the MA length and Z-Score thresholds to fit your trading style.
Açık kaynak kodlu komut dosyası
Gerçek TradingView ruhuyla, bu komut dosyasının mimarı, yatırımcıların işlevselliğini inceleyip doğrulayabilmesi için onu açık kaynaklı hale getirdi. Yazarı tebrik ederiz! Ücretsiz olarak kullanabilseniz de, kodu yeniden yayınlamanın Topluluk Kurallarımıza tabi olduğunu unutmayın.
Feragatname
Bilgiler ve yayınlar, TradingView tarafından sağlanan veya onaylanan finansal, yatırım, alım satım veya diğer türden tavsiye veya öneriler anlamına gelmez ve teşkil etmez. Kullanım Koşulları bölümünde daha fazlasını okuyun.