OPEN-SOURCE SCRIPT
Güncellendi Weekly & Daily High/Low Analyzer
Overview
The Weekly & Daily High/Low Analyzer indicator is designed to analyze the likelihood of achieving the High or Low of the day or week based on user-specified parameters. This tool is ideal for traders who want to identify potential turning points in the market by examining historical data.
Features
Visualization
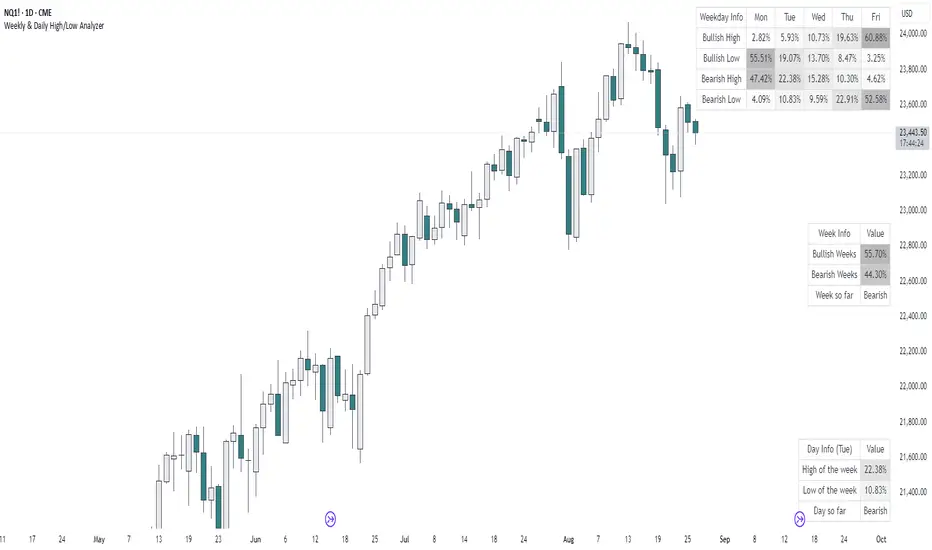
A table is displayed in the top right corner of the chart, showing the results of the analysis. The table highlights the hours or days with the highest probabilities in darker colors for easy identification.
How It Works
Inputs
Calculation and Display
Implementation
The script includes detailed logic for resetting values at the start of a new week or day, capturing opening and closing prices, and counting occurrences of highs and lows. The table displays data in a user-friendly format, with gradient colors indicating the probability strength.
Example Usage
Additional Information
This indicator is inspired by the knowledge shared by Omor and aims to provide traders with a statistical edge in predicting market movements.
The Weekly & Daily High/Low Analyzer indicator is designed to analyze the likelihood of achieving the High or Low of the day or week based on user-specified parameters. This tool is ideal for traders who want to identify potential turning points in the market by examining historical data.
Features
- Weekly High/Low Analysis: Available exclusively on the daily timeframe, this feature allows users to analyze past weeks to determine the probability of reaching the weekly high or low. Users can specify the number of weeks to analyze via the "Number of Weeks to Calculate" input field. Setting this field to 0 includes all available historical data. Note that the current week is excluded from the analysis as it is incomplete, and weekends (Saturdays and Sundays) are not analyzed.
- Daily High/Low Analysis: Available exclusively on the 1-hour timeframe, this feature analyzes past days to determine the probability of reaching the daily high or low. Users can specify the number of days to analyze via the "Number of Days to Calculate" input field. Setting this field to 0 includes all available historical data. The current day is excluded from the analysis as it is incomplete, and weekends (Saturdays and Sundays) are not analyzed.
Visualization
A table is displayed in the top right corner of the chart, showing the results of the analysis. The table highlights the hours or days with the highest probabilities in darker colors for easy identification.
How It Works
- Weekly Analysis: On the daily timeframe, the script analyzes each week's high and low points. It differentiates between bullish and bearish weeks and calculates the probability of reaching the high or low on each day of the week (Monday to Friday).
- Daily Analysis: On the 1-hour timeframe, the script examines the high and low points of each trading day. It differentiates between bullish and bearish days and calculates the probability of reaching the high or low at each hour of the trading day.
Inputs
- Number of Weeks to Calculate: An integer input that determines the number of past weeks to include in the analysis. Setting this to 0 includes all historical data.
- Number of Days to Calculate: An integer input that determines the number of past days to include in the analysis. Setting this to 0 includes all historical data.
Calculation and Display
- The indicator uses arrays to count the occurrences of highs and lows on bullish and bearish weeks and days.
- Probabilities are calculated and displayed in a table, with each row representing a day (for weekly analysis) or an hour (for daily analysis).
- Colors in the table indicate the strength of the probability, making it easy to identify significant patterns.
Implementation
The script includes detailed logic for resetting values at the start of a new week or day, capturing opening and closing prices, and counting occurrences of highs and lows. The table displays data in a user-friendly format, with gradient colors indicating the probability strength.
Example Usage
- Swing Traders: Can use the weekly analysis to identify potential high or low points for the week, aiding in setting entry or exit points.
- Day Traders: Can use the daily analysis to determine the most likely hours for reaching the high or low of the day, optimizing intraday trading strategies.
Additional Information
This indicator is inspired by the knowledge shared by Omor and aims to provide traders with a statistical edge in predicting market movements.
Sürüm Notları
The user can now select the size and position of the table.Sürüm Notları
ENHANCEMENT: Add tables with information/probability for the current week and day.ENHANCEMENT: Custom colors for tables.
Açık kaynak kodlu komut dosyası
Gerçek TradingView ruhuyla, bu komut dosyasının mimarı, yatırımcıların işlevselliğini inceleyip doğrulayabilmesi için onu açık kaynaklı hale getirdi. Yazarı tebrik ederiz! Ücretsiz olarak kullanabilseniz de, kodu yeniden yayınlamanın Topluluk Kurallarımıza tabi olduğunu unutmayın.
Feragatname
Bilgiler ve yayınlar, TradingView tarafından sağlanan veya onaylanan finansal, yatırım, alım satım veya diğer türden tavsiye veya öneriler anlamına gelmez ve teşkil etmez. Kullanım Koşulları bölümünde daha fazlasını okuyun.