OPEN-SOURCE SCRIPT
ATR %
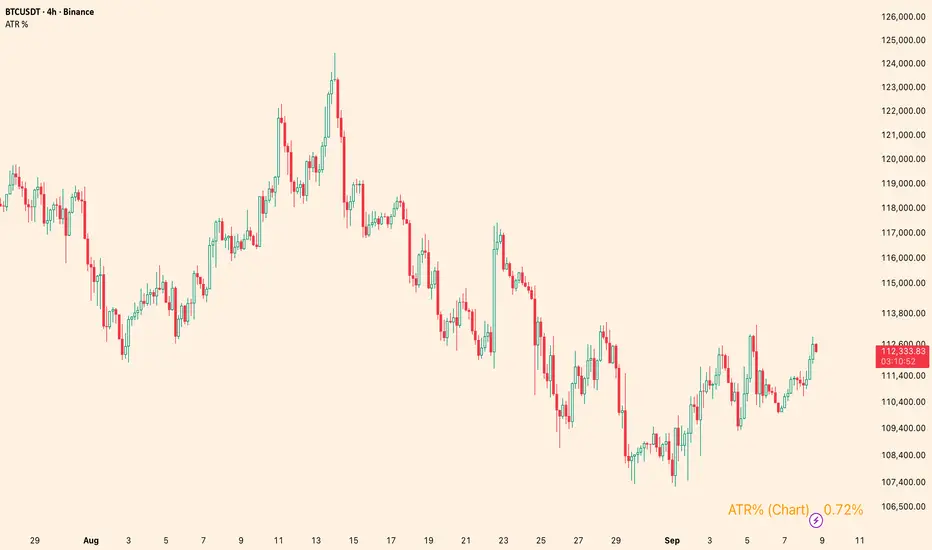
Overview
Shows the Average True Range (ATR) as a percentage of a chosen price basis. Useful for a quick, apples-to-apples view of current volatility across symbols and timeframes. The value is displayed in a clean table at the bottom-right of the chart.
What it shows
Inputs
Notes
Use cases
Disclaimer
For educational purposes only. Not financial advice. Trading involves risk.
Shows the Average True Range (ATR) as a percentage of a chosen price basis. Useful for a quick, apples-to-apples view of current volatility across symbols and timeframes. The value is displayed in a clean table at the bottom-right of the chart.
What it shows
- Basis can be: Close, EMA(len), SMA(len), or VWAP.
- Data timeframe can be the Chart timeframe or a Daily aggregation.
Inputs
- ATR length (len) – ATR lookback.
- Percent basis – Close / EMA / SMA / VWAP.
- Data timeframe – Chart (uses the current chart TF) or Daily (computes ATR and basis from daily data).
- Decimals – number of decimal places to display.
- Text / Background / Frame colors – customize the table appearance.
Notes
- In Daily mode, ATR and basis are taken from daily data and update on daily close.
- VWAP is available only in Chart mode (Daily + VWAP will show n/a by design).
- The script overlays the chart but does not plot lines—only a compact info box.
Use cases
- Compare volatility across coins/stocks quickly using ATR% instead of raw ATR.
- Switch basis to match your style (e.g., EMA for trend-aware scaling, VWAP for intraday context).
- Set Daily to track higher-timeframe volatility while trading lower TFs.
Disclaimer
For educational purposes only. Not financial advice. Trading involves risk.
Açık kaynak kodlu komut dosyası
Gerçek TradingView ruhuyla, bu komut dosyasının mimarı, yatırımcıların işlevselliğini inceleyip doğrulayabilmesi için onu açık kaynaklı hale getirdi. Yazarı tebrik ederiz! Ücretsiz olarak kullanabilseniz de, kodu yeniden yayınlamanın Topluluk Kurallarımıza tabi olduğunu unutmayın.
✅My Telegram
t.me/charyyevn
t.me/charyyevn
Feragatname
Bilgiler ve yayınlar, TradingView tarafından sağlanan veya onaylanan finansal, yatırım, alım satım veya diğer türden tavsiye veya öneriler anlamına gelmez ve teşkil etmez. Kullanım Koşulları bölümünde daha fazlasını okuyun.