OPEN-SOURCE SCRIPT
bgeraghty_FibCast
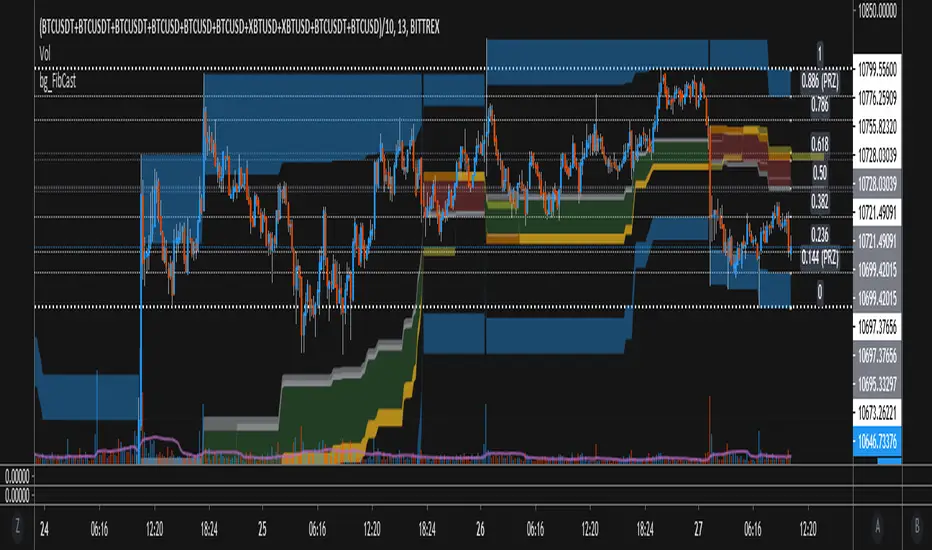
This script draws a High-To-Low or Low-To-High Fibonacci Retrace over the chart, based on which of those two happens in the given time period (Default is 144 Candles).
Updates from older versions:
- Paints 0.5, 0.618, 0.65 and spaces in between, giving good hindsight to the trend, and ideas of where strong support/resistance may lie.
- Silver Paint Strip = 0.50 retrace, Gold = 0.618-0.65, and the Red/Green between indicates the direction of the (Fib) Trend as H->L or L->H
- Paints 0.144 and 0.886 ranges Blue, and these are typically extremes or possible reversal zones. (PRZ)
Açık kaynak kodlu komut dosyası
Gerçek TradingView ruhuyla, bu komut dosyasının mimarı, yatırımcıların işlevselliğini inceleyip doğrulayabilmesi için onu açık kaynaklı hale getirdi. Yazarı tebrik ederiz! Ücretsiz olarak kullanabilseniz de, kodu yeniden yayınlamanın Topluluk Kurallarımıza tabi olduğunu unutmayın.
Feragatname
Bilgiler ve yayınlar, TradingView tarafından sağlanan veya onaylanan finansal, yatırım, alım satım veya diğer türden tavsiye veya öneriler anlamına gelmez ve teşkil etmez. Kullanım Koşulları bölümünde daha fazlasını okuyun.