OPEN-SOURCE SCRIPT
VWAP Bands @shrilss
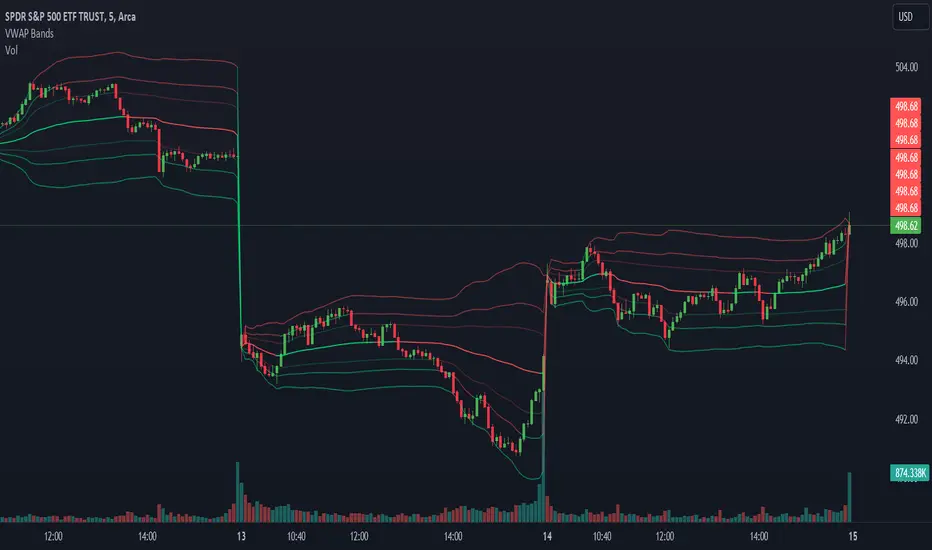
VWAP Bands Integrates VWAP with standard deviation bands to provide traders with insights into potential support and resistance levels based on volume dynamics. VWAP is a key metric used by institutional traders to gauge the average price a security has traded at throughout the trading day, taking into account both price and volume.
This script calculates the VWAP for each trading session and overlays it on the price chart as a solid line. Additionally, it plots multiple standard deviation bands around the VWAP to indicate potential areas of price extension or contraction. These bands are derived from multiplying the standard deviation of price by predetermined factors, offering traders a visual representation of potential price ranges.
This script calculates the VWAP for each trading session and overlays it on the price chart as a solid line. Additionally, it plots multiple standard deviation bands around the VWAP to indicate potential areas of price extension or contraction. These bands are derived from multiplying the standard deviation of price by predetermined factors, offering traders a visual representation of potential price ranges.
Açık kaynak kodlu komut dosyası
Gerçek TradingView ruhuna uygun olarak, bu komut dosyasının oluşturucusu bunu açık kaynaklı hale getirmiştir, böylece yatırımcılar betiğin işlevselliğini inceleyip doğrulayabilir. Yazara saygı! Ücretsiz olarak kullanabilirsiniz, ancak kodu yeniden yayınlamanın Site Kurallarımıza tabi olduğunu unutmayın.
Feragatname
Bilgiler ve yayınlar, TradingView tarafından sağlanan veya onaylanan finansal, yatırım, işlem veya diğer türden tavsiye veya tavsiyeler anlamına gelmez ve teşkil etmez. Kullanım Şartları'nda daha fazlasını okuyun.