OPEN-SOURCE SCRIPT
Güncellendi Stx Monthly Trades Profit
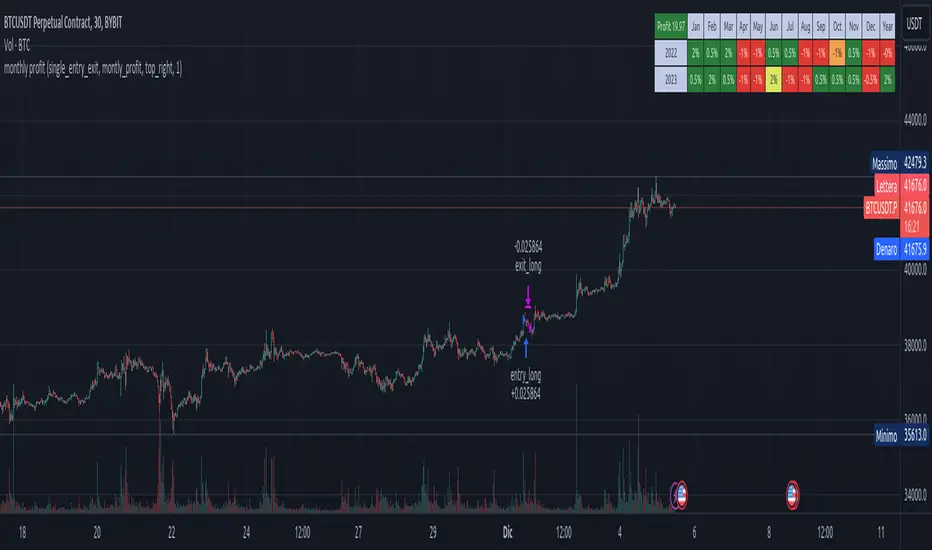
Monthly profit displays profits in a grid and allows you to know the gain related to the investment during each month.
The profit could be computed in terms of gain/trade_cost or as percentage of equity update.
Settings:
- Profit: Monthly profit percentage or percentage of equity
- Table position
This strategy is intended only as a container for the code and for testing the script of the profit table.
Setting of strategy allows to select the test case for this snippet (percentage grid).
Money management: not relevant as strategy is a test case.
This script stand out as take in account the gain of each trade in relation to the capital invested in each trade. For example consider the following scenario:
Capital of 1000$ and we invest a fixed amount of 1000$ (I know is too risky but is a good example), we gain 10% every month.
After 10 months our capital is of 2000$ and our strategy is perfect as we have the same performance every month.
Instead, evaluating the percentage of equity we have 10% the first month, 9.9% the second (1200$/1100$ - 1) and 5.26% the tenth month. So seems that strategy degrade with times but this is not true.
For this reason, to evaluate my strategy I prefer to see the montly return of investment.
WARNING: The strategy provided with this script is only a test case and allows to see the behavior with different "trades" management, for these reason commision are set to zero.
At the moment only the provided test cases are handled:
test 1 - single entry and single exit;
test 2 - single entry and multiple exits;
test 3 - single entry and switch position;
Sürüm Notları
Update documentationSürüm Notları
fix position reversal conditionSürüm Notları
add leverage setting for monthly_profit, in this way the script consider the profit_for_each_trade related to the trade investment as invested_capital * leverage.Sürüm Notları
add yearly summarySürüm Notları
Highlight the cell with min and max value.The first cell, starting from past with min, max is highlighted. Consider that values on the table are rounded therefore you can see highlighted value not at the first occourrence. For example 2.001% and 2.002% are shown both as 2% but the second will be higlighted.
Açık kaynak kodlu komut dosyası
Gerçek TradingView ruhuna uygun olarak, bu komut dosyasının oluşturucusu bunu açık kaynaklı hale getirmiştir, böylece yatırımcılar betiğin işlevselliğini inceleyip doğrulayabilir. Yazara saygı! Ücretsiz olarak kullanabilirsiniz, ancak kodu yeniden yayınlamanın Site Kurallarımıza tabi olduğunu unutmayın.
Feragatname
Bilgiler ve yayınlar, TradingView tarafından sağlanan veya onaylanan finansal, yatırım, işlem veya diğer türden tavsiye veya tavsiyeler anlamına gelmez ve teşkil etmez. Kullanım Şartları'nda daha fazlasını okuyun.