OPEN-SOURCE SCRIPT
主力资金进出监控器Main Capital Flow Monitor-MEWINSIGHT
Main Capital Flow Monitor Indicator
Indicator Description
This indicator utilizes a multi-cycle composite weighting algorithm to accurately capture the movement of main capital in and out of key price zones. The core logic is built upon three dimensions:
Multi-Cycle Pressure/Support System
Using triple timeframes (500-day/250-day/90-day) to calculate:
Long-term resistance lines (VAR1-3): Monitoring historical high resistance zones
Long-term support lines (VAR4-6): Identifying historical low support zones
EMA21 smoothing is applied to eliminate short-term fluctuations
Dynamic Capital Activity Engine
Proprietary VARD volatility algorithm:
VARD = EMA[ IF(Close Price ≤ Safety Margin Line, Volatility×10, Volatility÷10) ]
Automatically amplifies volatility sensitivity by 10x when price approaches the safety margin (VARA×1.35), precisely capturing abnormal main capital movements
Capital Inflow Trigger Mechanism
Capital entry signals require simultaneous fulfillment of:
Price touching 30-day low zone (VARE)
Capital activity breaking recent peaks (VARF)
Weighted capital flow verified through triple EMA:
Capital Entry = EMA[(VARD + VARF×2)/2] / 618
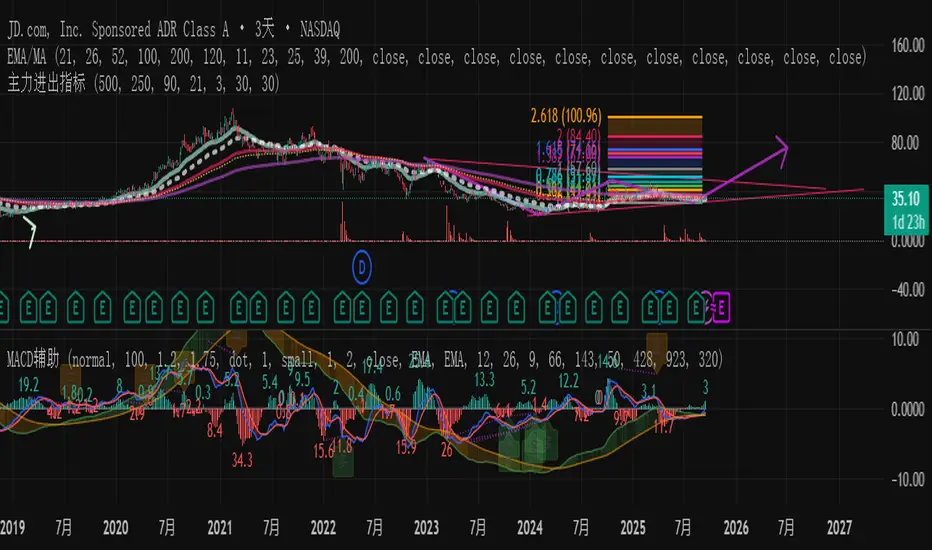
Visualization:
Green histogram: Continuous main capital inflow
Red histogram: Abnormal daily capital movement intensity
Column height intuitively displays capital strength
Application Scenarios:
Consecutive green columns → Main capital accumulation at bottom
Sudden expansion of red columns → Abnormal main capital rush
Continuous fluctuations near zero axis → Main capital washing phase
Core Value:
Provides 1-3 trading days early warning of main capital movements, suitable for:
Medium/long-term investors identifying main capital accumulation zones
Short-term traders capturing abnormal main capital breakouts
Risk control avoiding main capital distribution phases
Parameter Notes: Default parameters are optimized through historical A-share market backtesting. Users can adjust cycle parameters according to different market characteristics (suggest extending cycles by 20% for European/American markets).
Formula Features:
Multi-timeframe weighted synthesis technology
Dynamic sensitivity adjustment mechanism
Main capital activity intensity quantification
Early warning function for capital movements
Suitable Markets:
Stocks, futures, cryptocurrencies and other financial markets with obvious main capital characteristics.
指标名称:主力资金进出监控器
指标描述:
本指标通过多周期复合加权算法,精准捕捉主力资金在关键价格区域的进出动向。核心逻辑基于三大维度构建:
多周期压力/支撑体系
通过500日/250日/90日三重时间框架,分别计算:
长期压力线(VAR1-3):监控历史高位阻力区
长期支撑线(VAR4-6):识别历史低位承接区
采用EMA21平滑处理,消除短期波动干扰
动态资金活跃度引擎
独创VARD波动率算法:
当价格接近安全边际(VARA×1.35)时自动放大波动敏感度10倍,精准捕捉主力异动
资金进场触发机制
资金入场信号需同时满足:
价格触及30日最低区域(VARE)
资金活跃度突破近期峰值(VARF)
通过三重EMA验证的加权资金流:
资金入场 = EMA[(VARD + VARF×2)/2] / 618
可视化呈现:
绿色柱状图:主力资金持续流入
红色柱状图:当日资金异动量级
柱体高度直观显示资金强度
使用场景:
绿色柱体连续出现 → 主力底部吸筹
红色柱体突然放大 → 主力异动抢筹
零轴附近持续波动 → 主力洗盘阶段
核心价值:
提前1-3个交易日预警主力资金动向,适用于:
中长线投资者识别主力建仓区间
短线交易者捕捉主力异动突破
风险控制规避主力出货阶段
参数说明:默认参数经A股历史数据回测优化,用户可根据不同市场特性调整周期参数(建议欧美市场延长周期20%)
Indicator Description
This indicator utilizes a multi-cycle composite weighting algorithm to accurately capture the movement of main capital in and out of key price zones. The core logic is built upon three dimensions:
Multi-Cycle Pressure/Support System
Using triple timeframes (500-day/250-day/90-day) to calculate:
Long-term resistance lines (VAR1-3): Monitoring historical high resistance zones
Long-term support lines (VAR4-6): Identifying historical low support zones
EMA21 smoothing is applied to eliminate short-term fluctuations
Dynamic Capital Activity Engine
Proprietary VARD volatility algorithm:
VARD = EMA[ IF(Close Price ≤ Safety Margin Line, Volatility×10, Volatility÷10) ]
Automatically amplifies volatility sensitivity by 10x when price approaches the safety margin (VARA×1.35), precisely capturing abnormal main capital movements
Capital Inflow Trigger Mechanism
Capital entry signals require simultaneous fulfillment of:
Price touching 30-day low zone (VARE)
Capital activity breaking recent peaks (VARF)
Weighted capital flow verified through triple EMA:
Capital Entry = EMA[(VARD + VARF×2)/2] / 618
Visualization:
Green histogram: Continuous main capital inflow
Red histogram: Abnormal daily capital movement intensity
Column height intuitively displays capital strength
Application Scenarios:
Consecutive green columns → Main capital accumulation at bottom
Sudden expansion of red columns → Abnormal main capital rush
Continuous fluctuations near zero axis → Main capital washing phase
Core Value:
Provides 1-3 trading days early warning of main capital movements, suitable for:
Medium/long-term investors identifying main capital accumulation zones
Short-term traders capturing abnormal main capital breakouts
Risk control avoiding main capital distribution phases
Parameter Notes: Default parameters are optimized through historical A-share market backtesting. Users can adjust cycle parameters according to different market characteristics (suggest extending cycles by 20% for European/American markets).
Formula Features:
Multi-timeframe weighted synthesis technology
Dynamic sensitivity adjustment mechanism
Main capital activity intensity quantification
Early warning function for capital movements
Suitable Markets:
Stocks, futures, cryptocurrencies and other financial markets with obvious main capital characteristics.
指标名称:主力资金进出监控器
指标描述:
本指标通过多周期复合加权算法,精准捕捉主力资金在关键价格区域的进出动向。核心逻辑基于三大维度构建:
多周期压力/支撑体系
通过500日/250日/90日三重时间框架,分别计算:
长期压力线(VAR1-3):监控历史高位阻力区
长期支撑线(VAR4-6):识别历史低位承接区
采用EMA21平滑处理,消除短期波动干扰
动态资金活跃度引擎
独创VARD波动率算法:
当价格接近安全边际(VARA×1.35)时自动放大波动敏感度10倍,精准捕捉主力异动
资金进场触发机制
资金入场信号需同时满足:
价格触及30日最低区域(VARE)
资金活跃度突破近期峰值(VARF)
通过三重EMA验证的加权资金流:
资金入场 = EMA[(VARD + VARF×2)/2] / 618
可视化呈现:
绿色柱状图:主力资金持续流入
红色柱状图:当日资金异动量级
柱体高度直观显示资金强度
使用场景:
绿色柱体连续出现 → 主力底部吸筹
红色柱体突然放大 → 主力异动抢筹
零轴附近持续波动 → 主力洗盘阶段
核心价值:
提前1-3个交易日预警主力资金动向,适用于:
中长线投资者识别主力建仓区间
短线交易者捕捉主力异动突破
风险控制规避主力出货阶段
参数说明:默认参数经A股历史数据回测优化,用户可根据不同市场特性调整周期参数(建议欧美市场延长周期20%)
Açık kaynak kodlu komut dosyası
Gerçek TradingView ruhuyla, bu komut dosyasının mimarı, yatırımcıların işlevselliğini inceleyip doğrulayabilmesi için onu açık kaynaklı hale getirdi. Yazarı tebrik ederiz! Ücretsiz olarak kullanabilseniz de, kodu yeniden yayınlamanın Topluluk Kurallarımıza tabi olduğunu unutmayın.
Feragatname
Bilgiler ve yayınlar, TradingView tarafından sağlanan veya onaylanan finansal, yatırım, alım satım veya diğer türden tavsiye veya öneriler anlamına gelmez ve teşkil etmez. Kullanım Koşulları bölümünde daha fazlasını okuyun.