PROTECTED SOURCE SCRIPT
Güncellendi The Directional Cross Strategy
A simple chart-based strategy, which capitalizes on trend change.
Based on Azeez Mustapha's article featured in Stocks & Commodities Oct 2021 issue.
This indicator consists of three tools: a simple moving average (SMA), price envelopes, and Bollinger Bands.
Please note that this strategy only works in trending markets.
What is a trending market?
A trending market is one that is ascending with higher highs and higher lows or descending with lower highs and lower lows.
So, when the market is ranging it's not a good fit for this strategy. It is therefore advisable for the trader to stay out of the market when consolidation is noticed.
Usage of other tools in combination with this one is recommended to determine the market conditions.
Ok, so how to use this indicator:
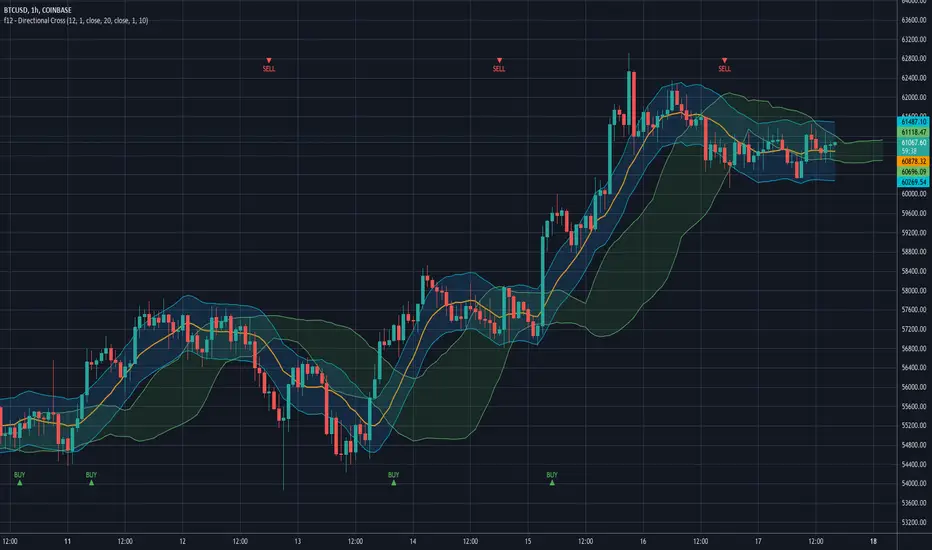
The combination of the indicators used in this strategy displays BUY and SELL alerts.
When the lower line of the envelope on the chart would cross over the lower band of the Bollinger Bands, a BUY alert is displayed.
When the upper line of the envelope on the chart would cross down the upper band of the Bollinger Bands, a SELL alert is displayed.
As always, proper risk management should be followed.
Based on Azeez Mustapha's article featured in Stocks & Commodities Oct 2021 issue.
This indicator consists of three tools: a simple moving average (SMA), price envelopes, and Bollinger Bands.
Please note that this strategy only works in trending markets.
What is a trending market?
A trending market is one that is ascending with higher highs and higher lows or descending with lower highs and lower lows.
So, when the market is ranging it's not a good fit for this strategy. It is therefore advisable for the trader to stay out of the market when consolidation is noticed.
Usage of other tools in combination with this one is recommended to determine the market conditions.
Ok, so how to use this indicator:
The combination of the indicators used in this strategy displays BUY and SELL alerts.
When the lower line of the envelope on the chart would cross over the lower band of the Bollinger Bands, a BUY alert is displayed.
When the upper line of the envelope on the chart would cross down the upper band of the Bollinger Bands, a SELL alert is displayed.
As always, proper risk management should be followed.
Sürüm Notları
Buy/Sell signals now coordinate with the BB offset.Korumalı komut dosyası
Bu komut dosyası kapalı kaynak olarak yayınlanmaktadır. Ancak, ücretsiz ve herhangi bir sınırlama olmaksızın kullanabilirsiniz – daha fazla bilgiyi buradan edinebilirsiniz.
Feragatname
Bilgiler ve yayınlar, TradingView tarafından sağlanan veya onaylanan finansal, yatırım, alım satım veya diğer türden tavsiye veya öneriler anlamına gelmez ve teşkil etmez. Kullanım Koşulları bölümünde daha fazlasını okuyun.
Korumalı komut dosyası
Bu komut dosyası kapalı kaynak olarak yayınlanmaktadır. Ancak, ücretsiz ve herhangi bir sınırlama olmaksızın kullanabilirsiniz – daha fazla bilgiyi buradan edinebilirsiniz.
Feragatname
Bilgiler ve yayınlar, TradingView tarafından sağlanan veya onaylanan finansal, yatırım, alım satım veya diğer türden tavsiye veya öneriler anlamına gelmez ve teşkil etmez. Kullanım Koşulları bölümünde daha fazlasını okuyun.