PROTECTED SOURCE SCRIPT
(JS) Tip-and-Dip Oscillator
Let me start by saying I know that the name is goofy lol
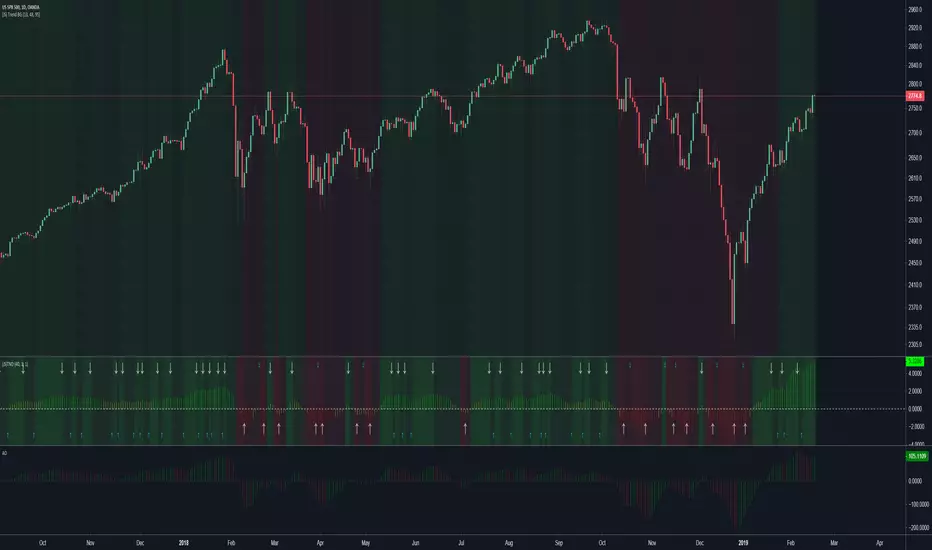
This is an oscillator that that looks at price action vs. standard deviation in order to illustrate the trend. This thing looks like an Awesome Oscillator but the math behind this and the Awesome Oscillator are totally different (which is pretty interesting, given they look a lot alike). I included the Awesome Oscillator on the chart here so you can look at them and see where they are different.
So the Tip-and Dip Oscillator is meant to help you pinpoint tops and bottoms. I even added arrows where the top and bottom signals are given.
The oscillator itself has 3 colors, an up, down, and neutral color that come as green, red, and yellow. Since the readings given by the oscillator can greatly vary depending on the chart resolution, I included an option to edit the range to fit your chart.
Also - I have 4 different smoothing options that you can use depending on what your preference is. The default setting is the most sensitive so it will identify tops and bottoms more frequently, but it is the most accurate when pinpointing the correct reversal candle. As you smooth it out, the arrows will appear less, but my be slightly delayed and give a later reading. I personally prefer the default, but going up to the second setting in smoothing works nicely as well.
Enjoy!
Korumalı komut dosyası
Bu komut dosyası kapalı kaynak olarak yayınlanmaktadır. Ancak, özgürce ve herhangi bir sınırlama olmaksızın kullanabilirsiniz – daha fazla bilgi burada.
Feragatname
Bilgiler ve yayınlar, TradingView tarafından sağlanan veya onaylanan finansal, yatırım, işlem veya diğer türden tavsiye veya tavsiyeler anlamına gelmez ve teşkil etmez. Kullanım Şartları'nda daha fazlasını okuyun.