OPEN-SOURCE SCRIPT
Güncellendi Al Brooks Second Entry
**\Al Brooks Second Entry Indicator\**
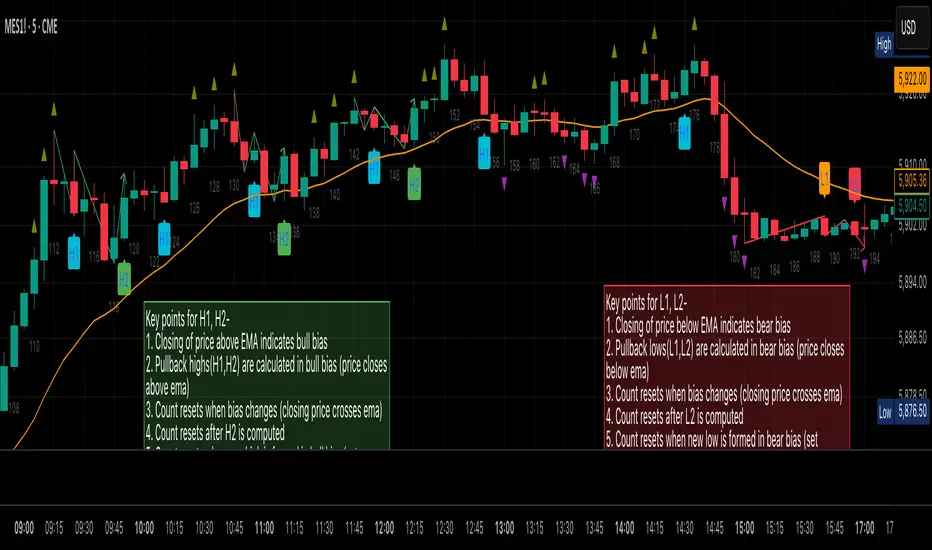
This custom indicator helps identify second-entry setups based on Al Brooks' price action principles. The script marks key levels in trending markets, indicating potential long and short entries. It displays the first and second entry signals (H1, H2, L1, L2) as well as relevant pullback zones for added clarity.
\Features:\
\
\Inputs:\
\
\How it Works:\
\
This script is ideal for traders looking to trade retracements in trending markets, providing clear entry signals and a visual representation of market structure.
This custom indicator helps identify second-entry setups based on Al Brooks' price action principles. The script marks key levels in trending markets, indicating potential long and short entries. It displays the first and second entry signals (H1, H2, L1, L2) as well as relevant pullback zones for added clarity.
\Features:\
\
\- \First Entry Signals\: H1 (Long) and L1 (Short) are marked when a trend begins to form.
\ - \Second Entry Signals\: H2 (Long) and L2 (Short) are plotted once the market pulls back and continues in the direction of the trend.
\ - \EMA Filter\: An Exponential Moving Average (EMA) is included to filter trades in the direction of the trend (longs above EMA, shorts below EMA).
\ - \Pullback Zones\: Highlighted areas to assist in identifying optimal zones for entry.
\[\*]\Adjustable Label Sizes\: Customize the appearance of the entry labels (tiny or small).
\
\Inputs:\
\
\- \Show First/Second Entry\: Control whether the first (H1, L1) and second (H2, L2) entry signals are displayed.
\ - \EMA Length\: Set the length of the EMA to use for trend direction.
\ - \Label Size\: Choose between tiny and small label sizes for clear chart visibility.
\ - \Pullback Zones\: Toggle the highlighting of pullback zones.
\
\How it Works:\
\
\- The indicator detects a trend direction using price action (new highs/lows, inside/outside bars).
\ - Once a trend is identified, it waits for a pullback and marks the first and second entry points (H1, H2, L1, L2).
\ - The indicator also plots the EMA to help confirm the overall market bias.
\ - Pullback zones are drawn to help spot potential areas of support or resistance.
\
This script is ideal for traders looking to trade retracements in trending markets, providing clear entry signals and a visual representation of market structure.
Sürüm Notları
Al Brooks Second Entry IndicatorThis custom indicator helps identify second-entry setups based on Al Brooks' price action principles. The script marks key levels in trending markets, indicating potential long and short entries. It displays the first and second entry signals (H1, H2, L1, L2) as well as relevant pullback zones for added clarity.
Features:
- First Entry Signals: H1 (Long) and L1 (Short) are marked when a trend begins to form.
- Second Entry Signals: H2 (Long) and L2 (Short) are plotted once the market pulls back and continues in the direction of the trend.
- EMA Filter: An Exponential Moving Average (EMA) is included to filter trades in the direction of the trend (longs above EMA, shorts below EMA).
- Pullback Zones: Highlighted areas to assist in identifying optimal zones for entry.
[\*]Adjustable Label Sizes: Customize the appearance of the entry labels (tiny or small).
Inputs:
- Show First/Second Entry: Control whether the first (H1, L1) and second (H2, L2) entry signals are displayed.
- EMA Length: Set the length of the EMA to use for trend direction.
- Label Size: Choose between tiny and small label sizes for clear chart visibility.
- Pullback Zones: Toggle the highlighting of pullback zones.
How it Works:
- The indicator detects a trend direction using price action (new highs/lows, inside/outside bars).
- Once a trend is identified, it waits for a pullback and marks the first and second entry points (H1, H2, L1, L2).
- The indicator also plots the EMA to help confirm the overall market bias.
- Pullback zones are drawn to help spot potential areas of support or resistance.
This script is ideal for traders looking to trade retracements in trending markets, providing clear entry signals and a visual representation of market structure.
Sürüm Notları
🔄 What's New in This Update- Improved Swing Detection & Trend Logic
- Replaced simple bar-by-bar comparisons with structured swing high/low detection.
- Added optional swing markers for clearer visual confirmation.
- Smarter Leg Tracking
- Added `waitForLegCompletion` logic to ensure accurate identification of pullback legs.
- Improved handling of trend transitions and bias resets, reducing false H1/H2 or L1/L2 signals.
- Cleaner Pullback Zone Management
- Pullback zones are now created, updated, and removed more reliably in response to trend legs.
- Resets zones correctly when trend direction or bias changes.
- Debugging Support
- Added optional `debugMode` input to display real-time leg count and bias state for easier troubleshooting.
- Visual Enhancements
- Optional swing high/low markers (`triangleup` / `triangledown`) for extra clarity.
- Label conditions refactored for better consistency across different market scenarios.
Sürüm Notları
Added notes in the code comment.Sürüm Notları
Update: 🔔 Alerting & Usability Enhancements- Added descriptive titles to plotted signals (H1, H2, L1, L2, Swing High/Low)
- Alerts are now available for all major entries and swing confirmations
Sürüm Notları
🔄 Major Improvements🐛 Bug Fixes
- Fixed incorrect H2 signals: Resolved the issue where the indicator would incorrectly show an H2 signal after a new swing high was detected, instead of correctly showing H1. This ensures proper pattern sequencing in all market conditions.
- Fixed pullback box rendering in bear markets: Corrected coordinates for pullback zones in bear trends to display properly.
🧠 Enhanced Pattern Detection
- Improved trend high/low tracking: Added dedicated flags to properly track when new highs/lows are made, ensuring accurate pattern reset.
- More reliable pattern sequencing: The indicator now correctly resets after new swing highs/lows, maintaining the proper H1→H2 and L1→L2 progression.
🧪 Expanded Debug Information
- Added detailed state tracking: Debug mode now shows additional information including leg direction and new high/low detection status.
- Better troubleshooting: Enhanced visualization makes it easier to understand the indicator's internal state.
📋 Technical Changes
- Added new state variables to track high/low detection events
- Refactored condition logic for more precise pattern identification
- Separated price level detection from pattern state management
- Improved visual feedback for pattern formation phases
📊 Usage Tips
- Enable debug mode to see detailed information about pattern formation
- Watch how the indicator resets after new trend highs/lows are made
Sürüm Notları
🔄 Update Notes: Version 2.0 – Confirmed-Bar Signal FilteringThis release introduces a major reliability upgrade by ensuring that all signals, labels, plots, and alerts are restricted to confirmed bars only (barstate.isconfirmed). This prevents premature triggers and false positives, especially in fast-moving markets.
✅ What’s New:
- Signal Filtering: All entries (H1, H2, L1, L2), swing points, debug labels, and pullback zones now display only after the bar closes.
- Alerts: All alert conditions now trigger exclusively on confirmed bars, improving accuracy for automated systems and notifications.
- Swing High/Low Improvements: Swing detection logic also respects bar confirmation for better consistency.
- Debug Mode Safety: Debug label only shows on the last confirmed bar for clean display and no clutter mid-bar.
⚙️ Why This Matters:
- Ensures trading decisions are based on complete price information.
- Avoids premature signals that may disappear before bar close.
- Makes it easier to integrate with automated strategies and alerts.
Sürüm Notları
Release Notes🔄 What's New in This Update
Visual Enhancements
- Added option to choose between newest high/low and swing high/low display on the chart.
Sürüm Notları
🔄 What's New in This Update🔍 Visual Enhancements
A new option has been added to show only strong signal bars (H1/H2 and L1/L2), helping reduce noise and highlight higher-quality entries.
📌 What Are Strong Signal Bars?
- Traditional H1/H2 and L1/L2 signals are identified based on pullback highs and lows.
- This update introduces a filter to hide weaker signals.
- To be considered “strong,” a signal bar must:
- Close stronger than the previous bar (higher for bullish, lower for bearish)
- Be bullish(close>open) for H2 or bearish (close<open) for L2
📊 Example Illustration
The two charts below show
Left Chart: All valid signals are displayed (including weaker ones).
Right Chart: “Show Strong Signal Only” is enabled.
Notice that in the left chart, an H1 signal appears when price breaks the previous high in a pullback. However, since the closing price of that candle is equal to the previous bar's close, it's filtered out on the right chart.
Sürüm Notları
📊 NEW FEATURE: Intraday Bar CounterTrack bar progression throughout the trading day with the new Bar Counter feature:
- Automatically displays bar numbers below every other bar for easy reference
- Counter resets at the start of each new trading day
- Fully customizable appearance (display, text color, size)
🔧 How to Use the Bar Counter
The bar counter helps you keep track of specific setups that occur at certain times or bar counts during the day. Simply enable it in the settings and configure to your preference:
- Show Bar Counter - Toggle the counter on/off
- Bar Counter Size - Select your preferred label size
- Bar Counter Background - Choose the label background color
- Bar Counter Text Color - Choose the text color
📝 Why This Matters
Many traders find that certain setups work better at specific times or after a certain number of bars have formed. The intraday bar counter makes it easier to:
- Identify time-based patterns in your trading
- Keep track of bar counts for specific setups
- Build a more structured approach to intraday trading
💡 Additional Notes
- All original Al Brooks Second Entry detection features remain unchanged
- Performance optimized for minimal impact on chart responsiveness
- Color settings allow for easy visibility on any chart theme
Thank you for your continued support and happy trading!
Sürüm Notları
📊 NEW FEATURE: Secondary EMA- Secondary EMA to be displayed on the chart in addition to Primary EMA
- Option to toggle secondary EMA display on the chart
Sürüm Notları
🔄 What's New in This UpdateVisual Enhancements
- Enhanced strong signal bar condition to show H2/L2 signals only if the candle closes within the top 30% (for H2) or the bottom 30% (for L2) of the candle's range.
✅ Why This Matters
This avoids false breakouts where:
- Price spiked high but then pulled back and closed weakly.
- You want confirmation that buyers (or sellers) held the move into the close.
Sürüm Notları
Removed H1/L1 condition from strong signal bar detection. Strong signal bar should not be required for H1/L1, since the actual signals are H2/L2. So limiting the strong signal bar detection for H2/L2.Sürüm Notları
Added an option to control whether you want to wait till the candle close to see the signal on the chart or not. By default it will wait till candle close, if you uncheck the box, it will start calculating and showing signals on every tick change.Açık kaynak kodlu komut dosyası
Gerçek TradingView ruhuyla, bu komut dosyasının mimarı, yatırımcıların işlevselliğini inceleyip doğrulayabilmesi için onu açık kaynaklı hale getirdi. Yazarı tebrik ederiz! Ücretsiz olarak kullanabilseniz de, kodu yeniden yayınlamanın Topluluk Kurallarımıza tabi olduğunu unutmayın.
Feragatname
Bilgiler ve yayınlar, TradingView tarafından sağlanan veya onaylanan finansal, yatırım, alım satım veya diğer türden tavsiye veya öneriler anlamına gelmez ve teşkil etmez. Kullanım Koşulları bölümünde daha fazlasını okuyun.
Açık kaynak kodlu komut dosyası
Gerçek TradingView ruhuyla, bu komut dosyasının mimarı, yatırımcıların işlevselliğini inceleyip doğrulayabilmesi için onu açık kaynaklı hale getirdi. Yazarı tebrik ederiz! Ücretsiz olarak kullanabilseniz de, kodu yeniden yayınlamanın Topluluk Kurallarımıza tabi olduğunu unutmayın.
Feragatname
Bilgiler ve yayınlar, TradingView tarafından sağlanan veya onaylanan finansal, yatırım, alım satım veya diğer türden tavsiye veya öneriler anlamına gelmez ve teşkil etmez. Kullanım Koşulları bölümünde daha fazlasını okuyun.