OPEN-SOURCE SCRIPT
Equity chart [LM]
Hey Guys,
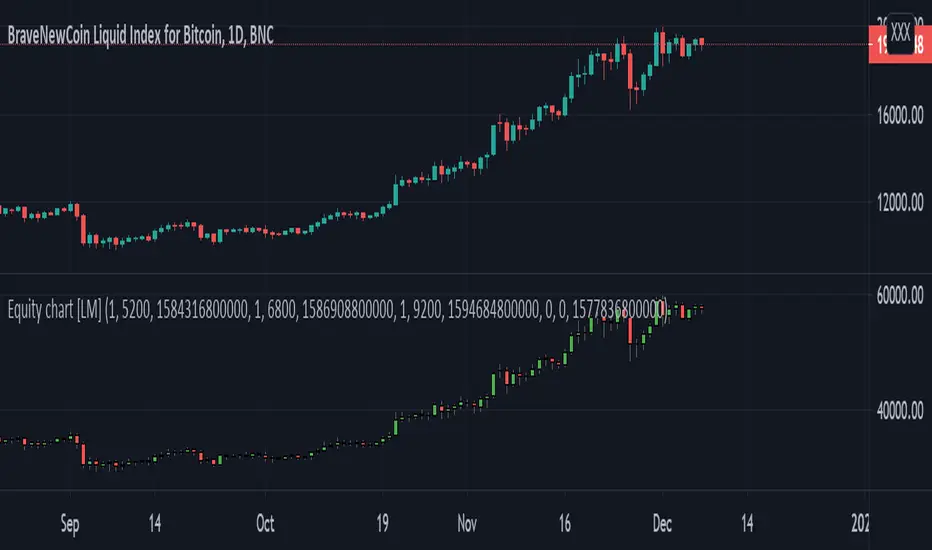
I have created draft version of chart where you can put your position amount and position price and position date for each entry and it will chart your equity as candle stick chart. There are currently possible to include 4 positions but you can add as many you like by modyfing the code.
It will calculate your average entry based on your input and in date where you add other entry it will create gap. I have already plan to include there also leverage on each position. The idea is that you should trade your equity and with this indicator you will be able to create your custom indicator based on equity chart and not price chart.
!! Unless you will enter position nothing will be rendered
Indicator is under breadth indicator because didn't know where to put it.
I release this script for collaboration and improving the idea with new features
Cheers,
Lukas
Açık kaynak kodlu komut dosyası
Gerçek TradingView ruhuyla, bu komut dosyasının mimarı, yatırımcıların işlevselliğini inceleyip doğrulayabilmesi için onu açık kaynaklı hale getirdi. Yazarı tebrik ederiz! Ücretsiz olarak kullanabilseniz de, kodu yeniden yayınlamanın Topluluk Kurallarımıza tabi olduğunu unutmayın.
Feragatname
Bilgiler ve yayınlar, TradingView tarafından sağlanan veya onaylanan finansal, yatırım, alım satım veya diğer türden tavsiye veya öneriler anlamına gelmez ve teşkil etmez. Kullanım Koşulları bölümünde daha fazlasını okuyun.