OPEN-SOURCE SCRIPT
BRT CHARTS MTF
Description of the Indicator
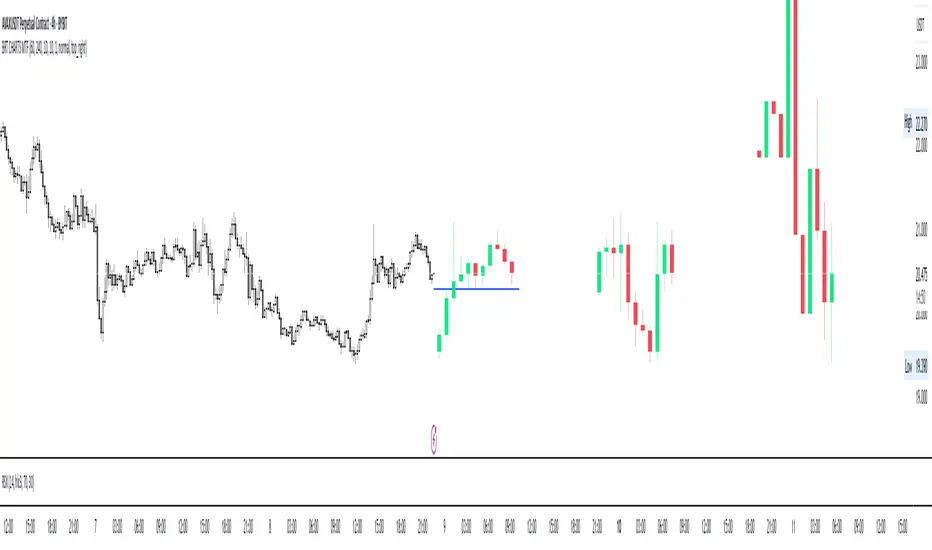
This indicator is designed to visualize and analyze price movements across multiple timeframes simultaneously. It displays candles from selected time intervals directly on the current chart, allowing traders to quickly assess market conditions without switching between different timeframes. This is particularly useful for traders who use multi-timeframe analysis to make trading decisions.
Key Features of the Indicator:
1. Displaying Candles from Multiple Timeframes:
- The indicator allows you to select three timeframes (e.g., 1 hour, 4 hours, and 1 day) and displays their candles on the current chart. This helps to see the overall market picture without switching between charts.
- Candles are displayed as vertical columns, each containing the body and wicks (shadows) of the candle. The colors of the candles (green for bullish and red for bearish) are customizable.
2. Dynamic Updates:
- The indicator automatically updates the candles as new data arrives, allowing you to track market changes in real time.
3. Customizable Number of Candles:
- The user can choose how many candles to display for each timeframe (default is 4 candles). This allows the indicator to be adapted to individual needs.
4. Range Display (High/Low):
- The indicator can show High and Low levels for each timeframe, helping to identify key support and resistance levels.
- It is also possible to display the Mid level (average between High and Low), which can be useful for identifying consolidation zones.
5. Data Table:
- The indicator supports displaying a table with key levels (High, Low, Mid) for each timeframe. The table can be placed in any corner of the chart, and its size and text/background colors are customizable.
6. Flexible Appearance Settings:
- The user can customize the colors of the candles, their wicks, High/Low/Mid levels, as well as the placement of the columns on the chart.
How the Indicator Helps in Trading:
- Multi-Timeframe Analysis: The indicator allows you to analyze multiple timeframes simultaneously, helping to better understand the overall trend and find entry points. For example, if the trend is bullish on the daily timeframe and there is a correction on the hourly timeframe, this could be a good opportunity to buy.
- Identifying Key Levels: Displaying High, Low, and Mid levels helps quickly identify support and resistance zones, which is useful for setting stop-loss and take-profit levels.
- Time-Saving: The indicator eliminates the need to switch between timeframes, speeding up the analysis and decision-making process.
- Visual Clarity: Visualizing candles from different timeframes on a single chart makes analysis more convenient and intuitive.
Example Use Cases:
1. Trend Trading: If a clear uptrend is visible on the daily timeframe and a correction is occurring on the hourly timeframe, you can look for buy opportunities near support levels.
2. Range Trading: If the price is moving sideways across all timeframes, you can use High and Low levels to trade from the boundaries of the range.
3. Identifying Reversal Points: If the price approaches a key resistance level on the higher timeframe and a bearish candle forms on the lower timeframe, this could be a signal to sell.
Conclusion:
This indicator is a powerful tool for traders who use multi-timeframe analysis. It helps quickly assess market conditions, identify key levels, and make informed trading decisions. Thanks to its flexible settings, the indicator can be adapted to any trading style and visualization preferences.
Açık kaynak kodlu komut dosyası
Gerçek TradingView ruhuyla, bu komut dosyasının mimarı, yatırımcıların işlevselliğini inceleyip doğrulayabilmesi için onu açık kaynaklı hale getirdi. Yazarı tebrik ederiz! Ücretsiz olarak kullanabilseniz de, kodu yeniden yayınlamanın Topluluk Kurallarımıza tabi olduğunu unutmayın.
Feragatname
Bilgiler ve yayınlar, TradingView tarafından sağlanan veya onaylanan finansal, yatırım, alım satım veya diğer türden tavsiye veya öneriler anlamına gelmez ve teşkil etmez. Kullanım Koşulları bölümünde daha fazlasını okuyun.