OPEN-SOURCE SCRIPT
BTC Hash Rate & Price Stochastic Indiciator
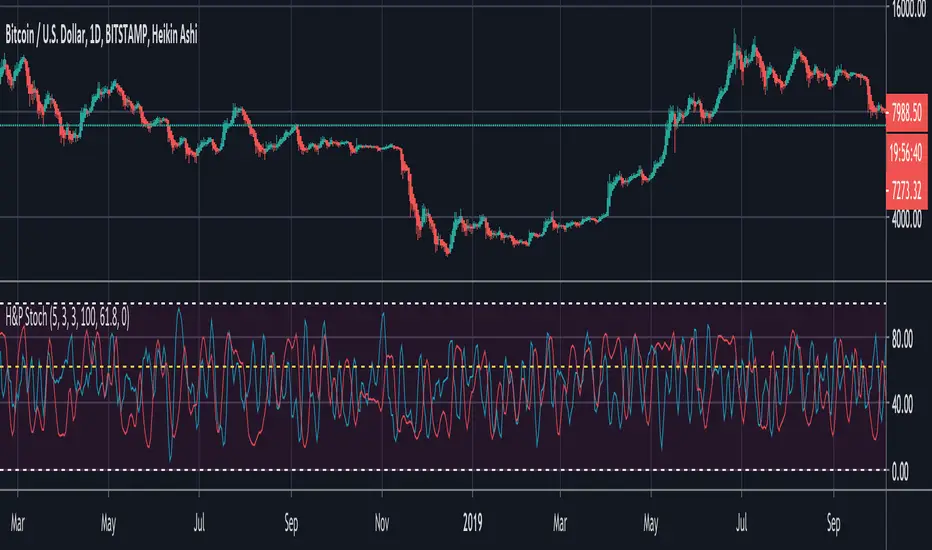
Fresh off the press, we have a new breed of indicators: Bitcoin's Hash Rate & Price.
As many of you have read, roughly 80% of BTC's price movements can be correlated to its changes in hash rate volume. I decided to make a stochastic indicator that utilizes this principle to track divergence of the price from the hash rate.
Let's break this down...
In red is the CLOSE of BTC's Price, which is then smoothed by a SMA, and smoothed again by a WMA.
In aqua is a STOCH of BTC's Hash Rate, which is then smoothed by a SMA, and smoothed again by a WMA.
The reason why I chose to use the CLOSE of the Price versus a STOCH as I did with the Hash Rate, is because the price tends to signal trends via divergence from the Hash Rate, and eventually converge with the Hash Rate at some point.
You will notice that anytime there is a significant divergence of the RED from the AQUA, a trend is closely aligned with it. This indicator does a remarkable job of indicating the beginnings and ends of both bullish and bearish price movements.
Example Strategy:
Enter long when RED (price) crosses over AQUA (hash rate), and close long when RED crosses under AQUA.
The inverse can be done for shorts, just RED diverges downwards from AQUA versus upwards.
Note:
Unlike a normal Stochastic Indicator, the upper and lower bounds do not appear to hold any significance. In other words, the lines do not seem to reverse at 20/80. As a result, I just set them to 0/100 for aesthetics.
DO NOT make trades based off of small divergences, or simply enter into positions based off the price divergences. Though this indicator times the start/end of movements very accurately, it also comes riddled with false breakouts.
Proceed at your own pace, and please, toy around with the inputs values. I experimented with a few combinations, but I'm sure there are better value combinations that yield sharper results with fewer false signals.
EASTER EGG:
Notice the "Golden Line"? Any avid user of TV knows that Fibonacci ratios show up everywhere in markets. With that said, I plotted a horizontal line at 0.618, which is 1/Phi, an important level in Fibonacci retracements.
Final Comments:
First, this is not investment, merely my experimentation and observation of happenings in the analytical world.
Second, please comment questions, improvements, etc. Dialogue opens up room for exploration!
Açık kaynak kodlu komut dosyası
Gerçek TradingView ruhuna uygun olarak, bu komut dosyasının oluşturucusu bunu açık kaynaklı hale getirmiştir, böylece yatırımcılar betiğin işlevselliğini inceleyip doğrulayabilir. Yazara saygı! Ücretsiz olarak kullanabilirsiniz, ancak kodu yeniden yayınlamanın Site Kurallarımıza tabi olduğunu unutmayın.
Feragatname
Bilgiler ve yayınlar, TradingView tarafından sağlanan veya onaylanan finansal, yatırım, işlem veya diğer türden tavsiye veya tavsiyeler anlamına gelmez ve teşkil etmez. Kullanım Şartları'nda daha fazlasını okuyun.