PROTECTED SOURCE SCRIPT
Güncellendi THE WICKLESS CANDLE By [VXN]
The Wickless Candles Strategy - Comprehensive Analysis
Core Concept
The "Wickless Candles" strategy is a technical analysis approach that identifies specific candlestick formations where one side of the candle has no wick, indicating strong directional momentum and potential support/resistance levels.
What Are Wickless Candles?
Bullish Wickless Candles
Meaning: A green candle where the opening price equals the lowest price
Significance: Shows that buyers immediately took control and never let price fall below the opening level
Implication: The opening price becomes a strong support level
Bearish Wickless Candles
Meaning: A red candle where the opening price equals the highest price
Significance: Shows that sellers immediately dominated and never let price rise above the opening level
Implication: The opening price becomes a strong resistance level
Visual Strategy Elements
Support/Resistance Lines
Bullish Lines: Green horizontal lines drawn at the low (open) price of wickless bullish candles
Bearish Lines: Red horizontal lines drawn at the high (open) price of wickless bearish candles
Extension: Lines project forward for 5 bars (configurable) to highlight key levels
Purpose: These levels often act as future support/resistance zones
Advanced Volume Analysis (4:00 AM - 9:29 AM Session)
Volume Calculations
Market Dominance Indicators
🟢🟢🟢🔴: Buyer dominance (more buying pressure)
🔴🔴🔴🟢: Seller dominance (more selling pressure)
🟢🟢🔴🔴: Balanced market (equal pressure)
Comprehensive Statistics Monitor
Wickless Candle Metrics
Bullish Count: Total number of bullish wickless candles detected
Bearish Count: Total number of bearish wickless candles detected
Total Wickless: Combined count of all wickless formations
Max Scanned: Total number of candles analyzed
Percentages: Bullish vs bearish distribution ratios
Volume Intelligence
Current Volume: Real-time session volume in millions
Buyer/Seller Percentages: Relative strength of each side
Market Dominance: Visual representation of controlling force
Strategic Applications
Entry Signals
Long Entries: Near bullish wickless candle support lines
Short Entries: Near bearish wickless candle resistance lines
Confirmation: Use volume dominance to confirm directional bias
Market Context
Institutional Interest: Wickless candles often indicate large player activity
Price Rejection: Shows where market participants strongly defended levels
Momentum Confirmation: Volume analysis validates the strength behind moves
Key Advantages
Objective Identification: Clear mathematical criteria for wickless formations
Real-Time Monitoring: Live statistics and volume analysis
Multi-Timeframe Application: Works across different chart intervals
Alert System: Automatic notifications when new levels are established
Visual Clarity: Easy-to-spot support/resistance lines on chart
This strategy combines traditional candlestick analysis with modern volume profiling to identify high-probability trading zones where institutional and retail sentiment align at specific price levels.
Sürüm Notları
Major Update Summary & New Features Added1. Smart Line Management
Auto-Delete Used Lines: Configurable setting to automatically remove lines once price crosses through them
Line Lifecycle Tracking: Complete monitoring of line creation, usage, and deletion
Memory Optimization: Prevents chart clutter by intelligently managing active lines
2. Advanced Retest Detection
Bullish Retest Alerts: Triggered when price dips below support line but closes above (one-time per line)
Bearish Retest Alerts: Triggered when price spikes above resistance line but closes below (one-time per line)
Smart Alert Logic: Prevents duplicate notifications with built-in retest tracking
3. Professional Dark Theme
Modern Color Palette: Carefully selected dark theme colors for enhanced visibility
Improved Contrast: Better readability with optimized text/background combinations
Consistent Styling: Unified design language throughout the entire interface
4. Customizable Table Interface
Resizable Dimensions: User-adjustable width (150-400px) and height (200-600px)
Dynamic Font Scaling: Automatic font size adjustment based on table dimensions
Enhanced Statistics: Added retest counters and line management metrics
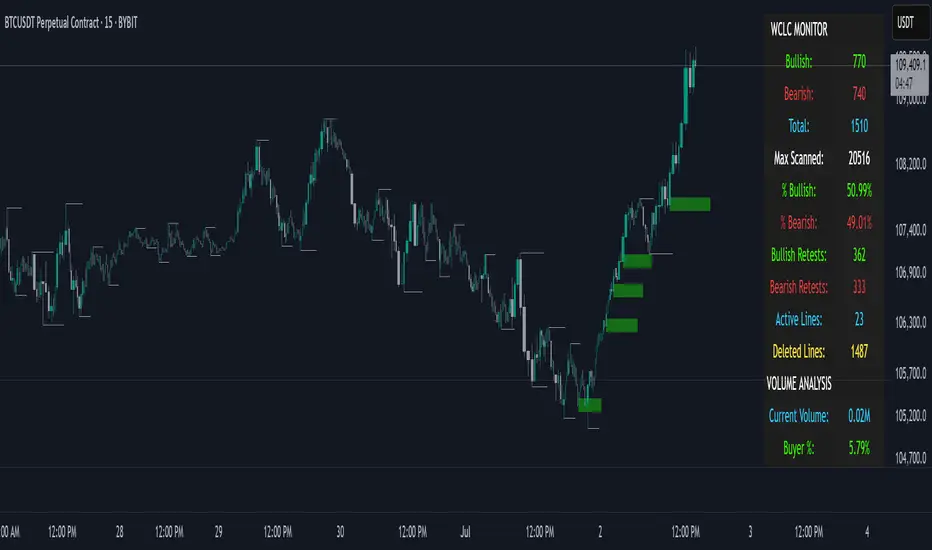
📊 Enhanced Statistics Monitor
New Metrics Added:
Active Lines Count
Deleted Lines Count
Bullish Retest Count
Bearish Retest Count
Improved Organization:
Sectioned layout (Wickless Stats, Line Management, Volume Analysis, Table Info)
Color-coded categories for quick visual scanning
Professional data presentation
🔔 Alert System Expansion
4 Total Alert Types One Click:
Bullish Wickless Detection (Original)
Bearish Wickless Detection (Original)
Bullish Retest Detection (NEW)
Bearish Retest Detection (NEW)
Alert Features:
Detailed information including ticker, price, and timeframe
One-time retest alerts prevent spam
Immediate notification upon condition detection
⚡ Technical Improvements
Performance Optimizations:
Efficient array management for line tracking
Memory-conscious deletion processes
Scalable architecture for high-frequency trading
Code Quality:
Modular function design
Comprehensive error handling
Clean variable management
🎯 User Benefits
Cleaner Charts: Auto-deletion keeps charts uncluttered
Better Trade Timing: Retest alerts identify key reversal points
Enhanced Visibility: Dark theme reduces eye strain
Customizable Interface: Adjustable table size for any screen
Complete Analytics: Comprehensive statistics for strategy analysis
This update transforms the Wickless Candle indicator from a basic pattern detector into a comprehensive trading tool with intelligent line management, advanced alerting, and professional presentation.
Sürüm Notları
Added Stop Loss Level Identification System - Pivot High/Low detection
Clearer Chart
- Auto Delete Used Lines
Korumalı komut dosyası
Bu komut dosyası kapalı kaynak olarak yayınlanmaktadır. Ancak, ücretsiz ve herhangi bir sınırlama olmaksızın kullanabilirsiniz – daha fazla bilgiyi buradan edinebilirsiniz.
Feragatname
Bilgiler ve yayınlar, TradingView tarafından sağlanan veya onaylanan finansal, yatırım, alım satım veya diğer türden tavsiye veya öneriler anlamına gelmez ve teşkil etmez. Kullanım Koşulları bölümünde daha fazlasını okuyun.