Trendfinder
This description will provide a High Level description of how our Indicator identifies and visualizes Trends, followed by how to use the Indicator in your trading. At the end we would like to introduce our team and experience.
High Level Description of “Trendfinder”:
Our indicator analyzes a short term and long term trend. The Trend is determined off of volatility and MA analysis.
Combining both these concepts helps in Identifying the Trend and avoiding Ranges.
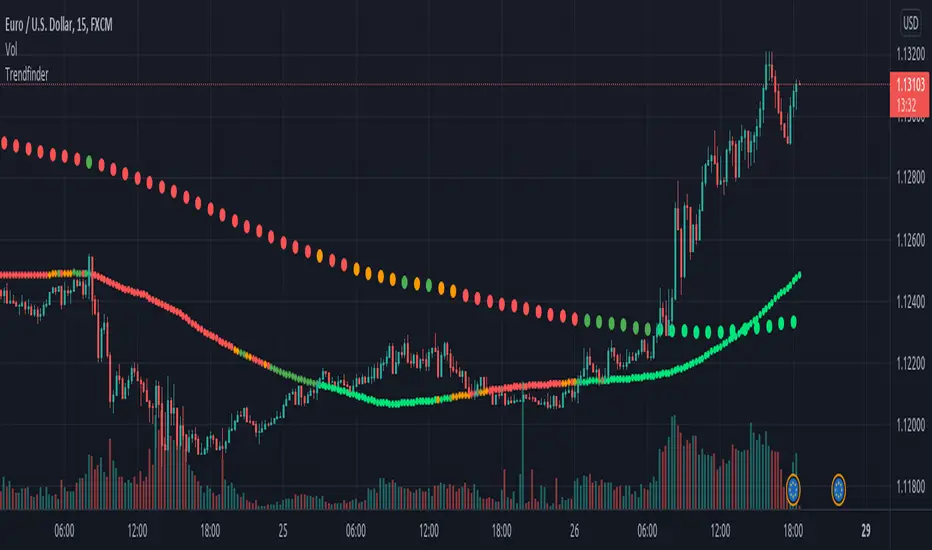
Visualisation:
The Trendfinder displays 2 dotted Lines. The Bigger dots is a long Term Trend Analysis which will be referred to as Longterm-Line from now on. The Smaller dots is the short term Trend which will be referred to as Shortterm-Line from now on.
Each Line can display 5 different colors symbolizing the Trend strength.
Gray → no trend
Green → weak bull trend
Lime → strong bull trend
Orange → weak bear trend
Red → strong bear trend
How to use it:
Our indicator is best used with Trend trading Strategies.
It is important to use Entry- and Exit strategies familiar with you, and not to use this Indicator as a Blind signal.
Its best to sync the Longterm-line with the Shortterm-line, to be trading in the same direction as the Long term Trend.
That being said, its advised to wait for the Longterm-line and Shortterm-line to be both either Bullish or both bearish.
Time frame:
This indicator is programmed to be used on all Timeframes.
Instruments:
This indicator aims to visualize areas of where Market price has the potential to trend, hence this is a trend trading Indicator.
Taking this statement to account, it is recommended to apply this Indicator to Instruments with a trending character.
Indicator settings and configuration:
The Indicator has no functional parameters, to reduce User error, and only has visual parameters. The color of the Supply and Demand Zones can be tailored to your liking.
Brief concept of Trend Trading:
Trend Trading is a concept that has been around for a very long time. Following links are helpful to get a grasp of the concept:
https://www.investopedia.com/terms/t/trendtrading.asp
Our Team:
We are a team of 3 Traders with a combined experience of 40 years. We are using our experiences from the market to create Indicators to Visualize the most relevant Patterns to us in our trading today. Our goal is to reconstruct these patterns to match our understanding of the market and to simplify the process of creating reproducible trading Strategies.
Yalnızca davetli komut dosyası
Only users approved by the author can access this script. You'll need to request and get permission to use it. This is typically granted after payment. For more details, follow the author's instructions below or contact account_closed directly.
TradingView, yazarına tam olarak güvenmediğiniz ve nasıl çalıştığını anlamadığınız sürece bir komut dosyası için ödeme yapmanızı veya kullanmanızı ÖNERMEZ. Ayrıca topluluk komut dosyaları bölümümüzde ücretsiz, açık kaynaklı alternatifler bulabilirsiniz.
Yazarın talimatları
Uyarı: Erişim talebinde bulunmadan önce lütfen yalnızca davetli komut dosyaları kılavuzumuzu okuyun.
Feragatname
Yalnızca davetli komut dosyası
Only users approved by the author can access this script. You'll need to request and get permission to use it. This is typically granted after payment. For more details, follow the author's instructions below or contact account_closed directly.
TradingView, yazarına tam olarak güvenmediğiniz ve nasıl çalıştığını anlamadığınız sürece bir komut dosyası için ödeme yapmanızı veya kullanmanızı ÖNERMEZ. Ayrıca topluluk komut dosyaları bölümümüzde ücretsiz, açık kaynaklı alternatifler bulabilirsiniz.
Yazarın talimatları
Uyarı: Erişim talebinde bulunmadan önce lütfen yalnızca davetli komut dosyaları kılavuzumuzu okuyun.