OPEN-SOURCE SCRIPT
Stoch + RSI Oscillator @shrilss
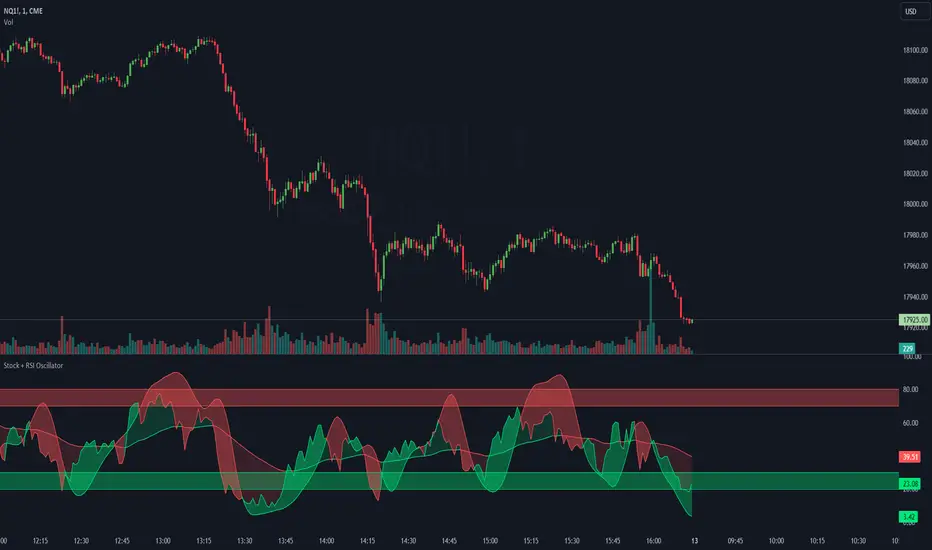
This script combines two powerful indicators, the Stochastic Oscillator and the Relative Strength Index (RSI), to offer traders a comprehensive view of market dynamics.
The Stochastic Oscillator, known for its effectiveness in identifying overbought and oversold conditions, is enhanced here with a smoothing mechanism to provide clearer signals. The script calculates the %K and %D lines of the Stochastic Oscillator, then applies a smoothing factor to %K, resulting in a smoother representation of price momentum.
Simultaneously, the RSI component offers insights into the strength of price movements. By comparing the average gains and losses over a specified period, it provides a measure of bullish and bearish sentiment within the market.
This script's innovation lies in its integration of these two indicators. The Stochastic Oscillator's smoothed %K line and the RSI are compared to dynamic thresholds, enabling traders to identify potential trend reversals and confirmations more effectively. When the RSI crosses above or below the Stochastic %D line, it can signal potential shifts in market momentum.
Açık kaynak kodlu komut dosyası
Gerçek TradingView ruhuyla, bu komut dosyasının mimarı, yatırımcıların işlevselliğini inceleyip doğrulayabilmesi için onu açık kaynaklı hale getirdi. Yazarı tebrik ederiz! Ücretsiz olarak kullanabilseniz de, kodu yeniden yayınlamanın Topluluk Kurallarımıza tabi olduğunu unutmayın.
Feragatname
Bilgiler ve yayınlar, TradingView tarafından sağlanan veya onaylanan finansal, yatırım, alım satım veya diğer türden tavsiye veya öneriler anlamına gelmez ve teşkil etmez. Kullanım Koşulları bölümünde daha fazlasını okuyun.