OPEN-SOURCE SCRIPT
Pearsons R historic breaks ( for making strategy out of it )
Pearsons R adjustments of linear regressions is a good tool to analyse visually the trend basis channeling of the market,
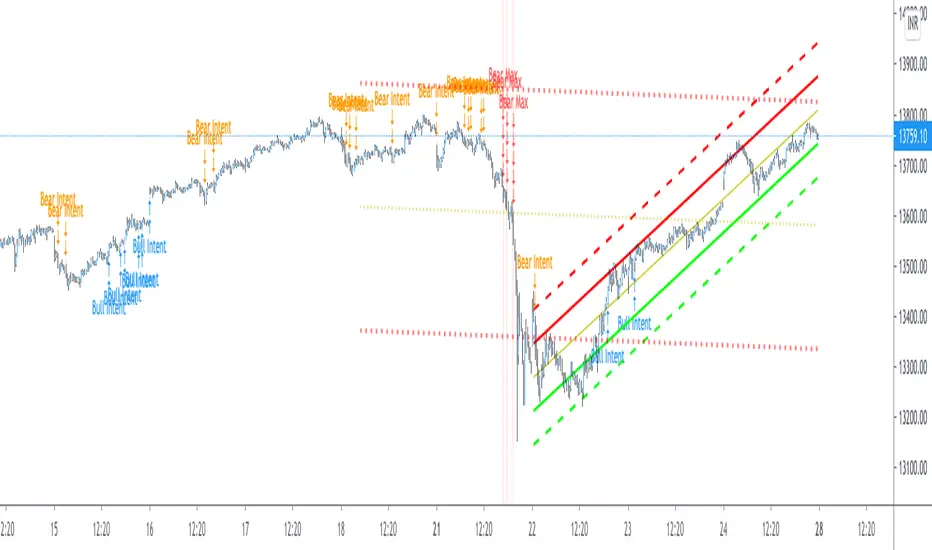
one of the common challenges in the scripts which i came across the tradingview community is the lack of the historic places put over the charts where the price actually crossed up/below the channel boundaries,
For me in order to do so we would have to replay the scripts over and over.
So I came up with an addon extension to a good script on the community (tradingview.com/script/FZXagyA6-Linear-Regression-Auto-Adjust-To-Ideal-Pearson-s-R-Min-Max/)
I have added the historic marks over the charts ( blue/green/red/orange Arrows which you see on the charts)
These arrows are the places where the price have crossed the channel boundaries historically
So,
Blue arrow = Bull Intent ,Place where the upper channel boundary line have been crossed
Orange arrow = Bear Intent , Place where the Lower channel boundary line have been crossed
Green arrow = Bull Max , Place where the Maximum Upper channel boundary line have been crossed
Red arrow = Bear Max , Place where the Minimum Lower channel boundary line have been crossed
For me this type of approach is good for making a strategy out of the concepts visually, in congestion to other indicators
I would suggest you guys to check this on alert basis with your setups to derive out the best from linear regressions
Lastly it would be a pleasure to give credits to the creators of Pearsons R scripts in Tradingview
@midtownsk8rguy
TradeBoneDogs
@x11joe [this code base is inspired from tradingview.com/script/FZXagyA6-Linear-Regression-Auto-Adjust-To-Ideal-Pearson-s-R-Min-Max/]
Also thanking Tradingview for providing us such an awesome community and platform :)
Açık kaynak kodlu komut dosyası
Gerçek TradingView ruhuyla, bu komut dosyasının mimarı, yatırımcıların işlevselliğini inceleyip doğrulayabilmesi için onu açık kaynaklı hale getirdi. Yazarı tebrik ederiz! Ücretsiz olarak kullanabilseniz de, kodu yeniden yayınlamanın Topluluk Kurallarımıza tabi olduğunu unutmayın.
Get Ocs Ai Trader, Your personal Ai Trade Assistant here
→ ocstrader.com
About me
AlgoTrading Certification, ( University of Oxford, Säid Business School )
PGP Research Analysis, ( NISM, SEBI )
Electronics Engineer
→ ocstrader.com
About me
AlgoTrading Certification, ( University of Oxford, Säid Business School )
PGP Research Analysis, ( NISM, SEBI )
Electronics Engineer
Feragatname
Bilgiler ve yayınlar, TradingView tarafından sağlanan veya onaylanan finansal, yatırım, alım satım veya diğer türden tavsiye veya öneriler anlamına gelmez ve teşkil etmez. Kullanım Koşulları bölümünde daha fazlasını okuyun.