OPEN-SOURCE SCRIPT
AntoQQE - Histogram
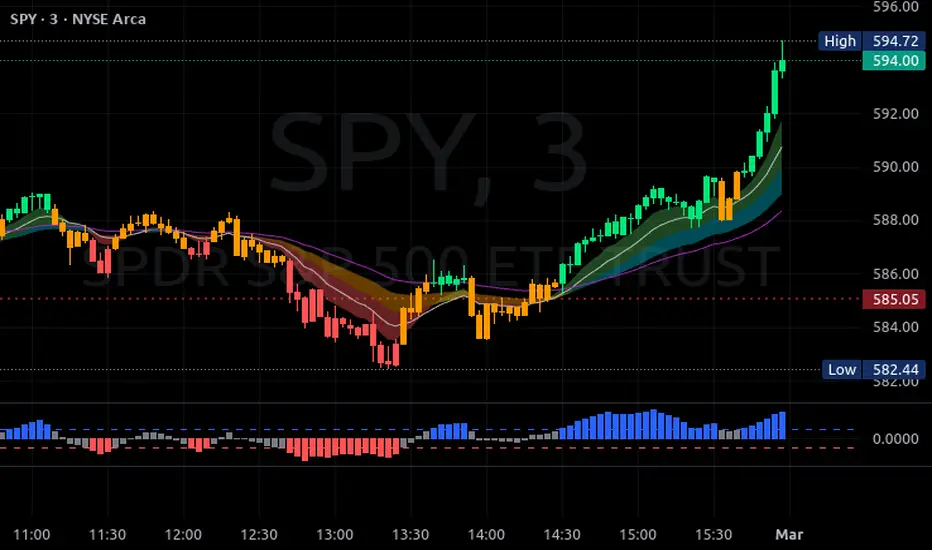
This script displays a QQE-based momentum histogram, derived from the RSI line’s deviation around a neutral 50 level. It uses a smoothed RSI, monitors volatility with a dynamically adjusted multiplier, and then plots a color-coded histogram that helps traders see when the RSI is entering strong bullish or bearish territory:
• Smoothed RSI Calculation
The script calculates RSI for a user-defined period and then smooths it with an EMA. This reduces noise in the indicator’s readings.
• Dynamic Average Range (DAR)
The script computes volatility by taking the absolute change of the smoothed RSI, applying two EMAs, and multiplying by a QQE factor. This produces a band around the RSI that adapts to changes in market volatility.
• Histogram Centering and Thresholds
Rather than plotting the RSI itself, the script subtracts 50 from the RSI to center it around zero. Columns are plotted for each bar:
Blue when momentum is significantly above zero (over a threshold value).
Red when momentum is significantly below zero (under a negative threshold).
Gray when momentum is within a neutral range.
• Usage
By observing when columns turn blue or red—and how far they extend above or below zero—traders can quickly gauge the market’s momentum. The horizontal threshold lines (dashed by default) provide clear breakout levels for bullish or bearish conditions, which can help confirm entries or exits based on shifting market sentiment. It is best paired with the AntoQQE - Bars indicator for better chart visualization.
Açık kaynak kodlu komut dosyası
Gerçek TradingView ruhuyla, bu komut dosyasının mimarı, yatırımcıların işlevselliğini inceleyip doğrulayabilmesi için onu açık kaynaklı hale getirdi. Yazarı tebrik ederiz! Ücretsiz olarak kullanabilseniz de, kodu yeniden yayınlamanın Topluluk Kurallarımıza tabi olduğunu unutmayın.
Feragatname
Bilgiler ve yayınlar, TradingView tarafından sağlanan veya onaylanan finansal, yatırım, alım satım veya diğer türden tavsiye veya öneriler anlamına gelmez ve teşkil etmez. Kullanım Koşulları bölümünde daha fazlasını okuyun.