OPEN-SOURCE SCRIPT
Güncellendi Premium Linear Regression - The Quant Science
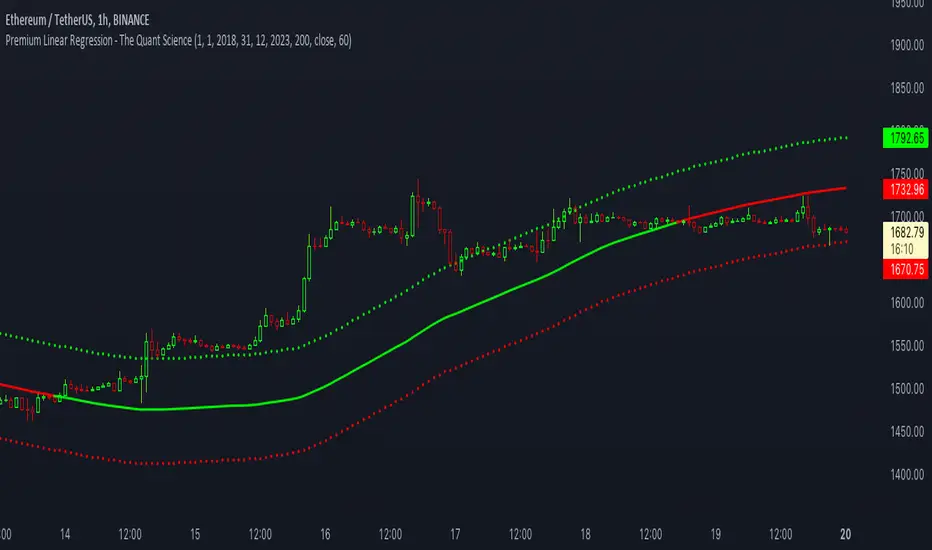
This script calculates the average deviation of the source data from the linear regression. When used with the indicator, it can plot the data line and display various pieces of information, including the maximum average dispersion around the linear regression.
The code includes various user configurations, allowing for the specification of the start and end dates of the period for which to calculate linear regression, the length of the period to use for the calculation, and the data source to use.
The indicator is designed for multi-timeframe use and to facilitate analysis for traders who use regression models in their analysis. It displays a green linear regression line when the price is above the line and a red line when the price is below. The indicator also highlights areas of dispersion around the regression using circles, with bullish areas shown in green and bearish areas shown in red.
Sürüm Notları
Added a function to adjust the linear regression deviation. The indicator adjusts the deviation data calculating only the time period selected by the user interface.Açık kaynak kodlu komut dosyası
Gerçek TradingView ruhuna uygun olarak, bu komut dosyasının oluşturucusu bunu açık kaynaklı hale getirmiştir, böylece yatırımcılar betiğin işlevselliğini inceleyip doğrulayabilir. Yazara saygı! Ücretsiz olarak kullanabilirsiniz, ancak kodu yeniden yayınlamanın Site Kurallarımıza tabi olduğunu unutmayın.
Feragatname
Bilgiler ve yayınlar, TradingView tarafından sağlanan veya onaylanan finansal, yatırım, işlem veya diğer türden tavsiye veya tavsiyeler anlamına gelmez ve teşkil etmez. Kullanım Şartları'nda daha fazlasını okuyun.
Açık kaynak kodlu komut dosyası
Gerçek TradingView ruhuna uygun olarak, bu komut dosyasının oluşturucusu bunu açık kaynaklı hale getirmiştir, böylece yatırımcılar betiğin işlevselliğini inceleyip doğrulayabilir. Yazara saygı! Ücretsiz olarak kullanabilirsiniz, ancak kodu yeniden yayınlamanın Site Kurallarımıza tabi olduğunu unutmayın.
Feragatname
Bilgiler ve yayınlar, TradingView tarafından sağlanan veya onaylanan finansal, yatırım, işlem veya diğer türden tavsiye veya tavsiyeler anlamına gelmez ve teşkil etmez. Kullanım Şartları'nda daha fazlasını okuyun.