OPEN-SOURCE SCRIPT
Chop Zones

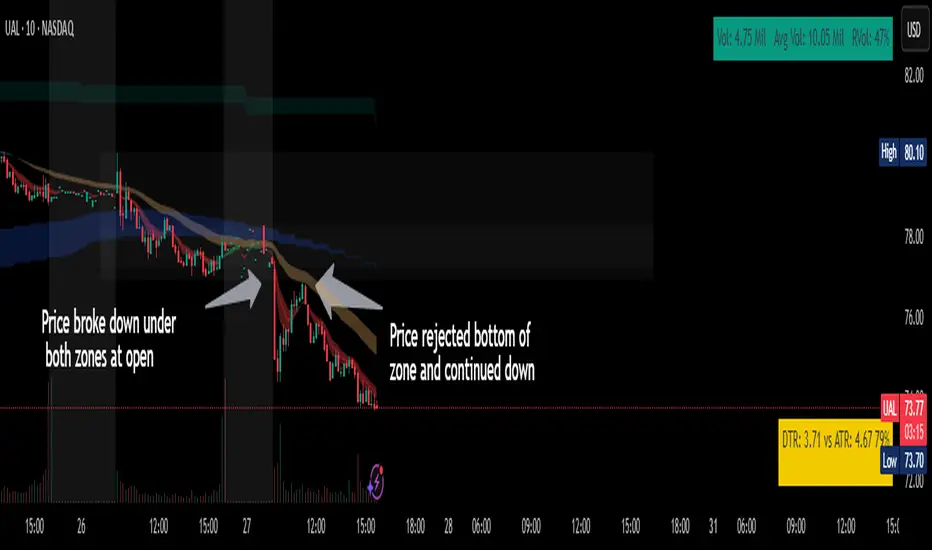
This indicator plots two "zones" in the form of shaded boxes, one between PMH and PML and one between PDH and PDL, the area that is shaded more has the highest probability of price action to be "choppy", the lesser shaded area has less probability for "choppy" action whilst outside the shaded areas there is high probability of a trend.
This indicator can be used to determine one of the three types of day:
Chop day
Bullish trend day
Bearish trend day
Chop day example today on SPY
SPY

Bullish trend day example on DLTR
DLTR

Bearish trend day example on UAL
UAL

This indicator can be used to determine one of the three types of day:
Chop day
Bullish trend day
Bearish trend day
Chop day example today on
Bullish trend day example on
Bearish trend day example on
Açık kaynak kodlu komut dosyası
Gerçek TradingView ruhuyla, bu komut dosyasının mimarı, yatırımcıların işlevselliğini inceleyip doğrulayabilmesi için onu açık kaynaklı hale getirdi. Yazarı tebrik ederiz! Ücretsiz olarak kullanabilseniz de, kodu yeniden yayınlamanın Topluluk Kurallarımıza tabi olduğunu unutmayın.
Feragatname
Bilgiler ve yayınlar, TradingView tarafından sağlanan veya onaylanan finansal, yatırım, alım satım veya diğer türden tavsiye veya öneriler anlamına gelmez ve teşkil etmez. Kullanım Koşulları bölümünde daha fazlasını okuyun.