PROTECTED SOURCE SCRIPT
3D Relative Strength Index
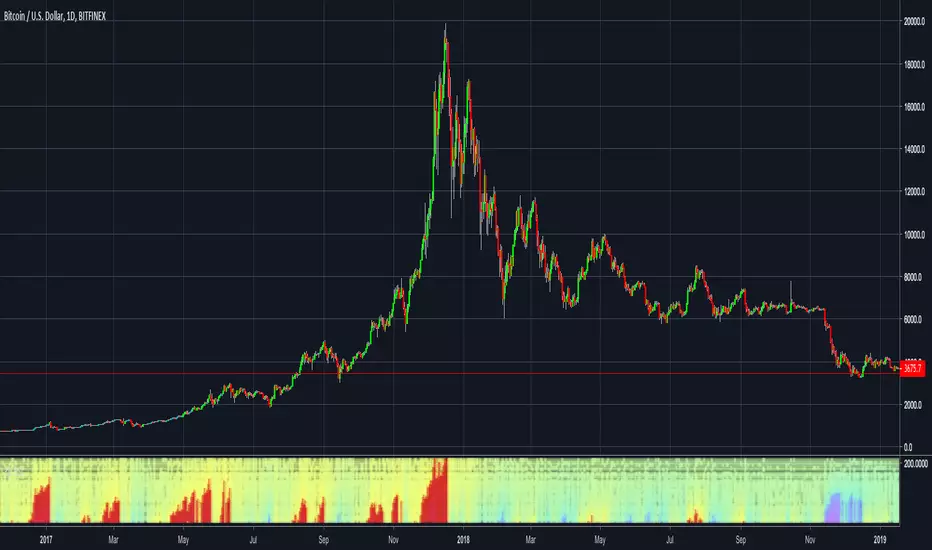
This indicator in form of a heatmap shows the longest periods of RSI values above 70 and under 30.
Red spots mean RSI is above 70 and blue ones RSI is under 30.
Red spots mean RSI is above 70 and blue ones RSI is under 30.
Korumalı komut dosyası
Bu komut dosyası kapalı kaynak olarak yayınlanmaktadır. Ancak, ücretsiz ve herhangi bir sınırlama olmaksızın kullanabilirsiniz – daha fazla bilgiyi buradan edinebilirsiniz.
Feragatname
Bilgiler ve yayınlar, TradingView tarafından sağlanan veya onaylanan finansal, yatırım, alım satım veya diğer türden tavsiye veya öneriler anlamına gelmez ve teşkil etmez. Kullanım Koşulları bölümünde daha fazlasını okuyun.