PROTECTED SOURCE SCRIPT
Mohammad - Auto TrendLines
Mohammad - Auto TrendLines
Overview
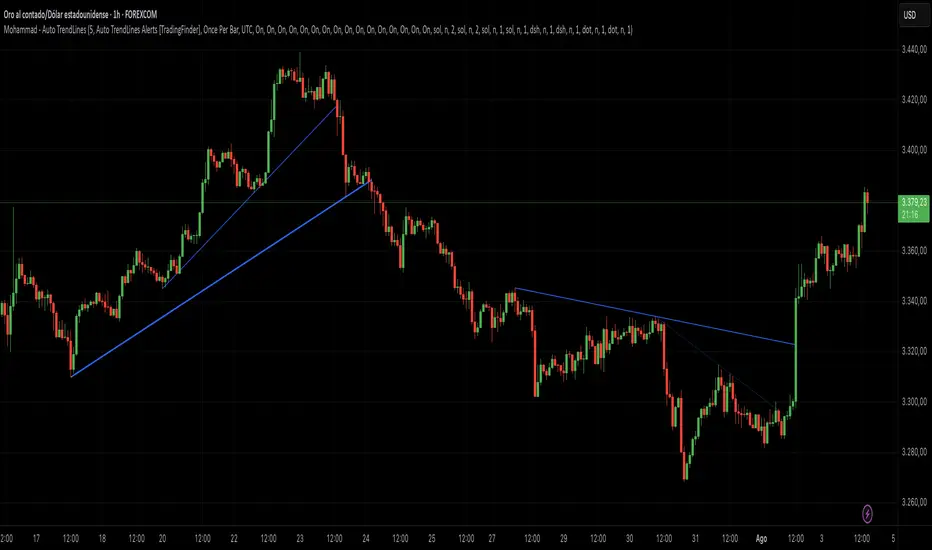
An advanced automatic trendline detection system that identifies and draws both major and minor trendlines based on pivot highs and lows. This indicator uses sophisticated algorithms to detect market structure and automatically plot relevant trendlines, helping traders identify key support and resistance levels without manual chart analysis.
Key Features
Automatic Detection: Identifies pivot points and connects them to form trendlines without manual intervention
Multi-Level Analysis: Distinguishes between Major and Minor trendlines, both External and Internal
Smart Validation: Only draws trendlines that haven't been violated by price action
Comprehensive Alerts: 16 different alert conditions for breaks and reactions to trendlines
Fully Customizable: Complete control over colors, styles, widths, and display preferences for each trendline type
How It Works
The indicator uses a ZigZag algorithm with configurable pivot periods to identify significant highs and lows. It then connects these points to form trendlines, validating them against historical price action to ensure they remain relevant. The system categorizes trendlines into Major/Minor and External/Internal based on their significance in the market structure.
Use Cases
This indicator is particularly useful for:
Identifying trend continuations and potential reversals
Finding optimal entry and exit points based on trendline breaks
Setting stop-loss levels using trendline support/resistance
Confirming trade setups with multiple timeframe analysis
Automating trendline detection for systematic trading strategies
Settings/Parameters
Pivot Period: Controls the sensitivity of pivot detection (default: 5)
Display Options: Toggle visibility for each of the 8 trendline types
Style Customization: Adjust color, line style, width, and extension for each trendline
Alert Configuration: Enable/disable alerts for breaks and reactions to each trendline type
Delete Previous: Option to remove old trendlines when new ones are formed
How to Use
Add the indicator to your chart and adjust the Pivot Period based on your trading timeframe
Configure which trendline types you want to display (Major/Minor, External/Internal, Up/Down)
Set up alerts for the specific trendline interactions you want to monitor
Look for price reactions at trendlines for potential trade entries
Use trendline breaks as confirmation for trend changes
Signals
Break Alerts: Triggered when price closes beyond a trendline
React Alerts: Triggered when price touches but respects a trendline
Major External: Most significant trendlines based on major pivot points
Major Internal: Secondary major trendlines within the trend structure
Minor External: Short-term trendlines for intraday movements
Minor Internal: Smallest scale trendlines for precise entries
Trendline Types Explained
Up Trendlines: Connect ascending lows, act as support
Down Trendlines: Connect descending highs, act as resistance
External: Connect the outermost pivots
Internal: Connect pivots within the major structure
Best Timeframes
Works effectively on all timeframes:
Scalping: 1m, 5m, 15m charts
Day Trading: 15m, 1H, 4H charts
Swing Trading: 4H, Daily, Weekly charts
Position Trading: Daily, Weekly, Monthly charts
Important Notes
The indicator repaints trendlines as new pivots form - this is by design to maintain accuracy
Historical trendlines that have been broken are automatically extended to show past levels
Use multiple timeframe analysis for best results
Combine with other indicators for trade confirmation
Always use proper risk management
Alert Integration
This indicator uses the TradingFinder Alert Library for enhanced alert functionality, providing detailed notifications for all trendline interactions.
Version History
v6: Current version with full alert integration and enhanced trendline validation
Disclaimer: This indicator is for educational and informational purposes only. Past performance does not guarantee future results. Always conduct your own analysis and use proper risk management when trading.
Note: This is an overlay indicator that draws directly on your price chart. Ensure you have sufficient chart history loaded for optimal performance.
Overview
An advanced automatic trendline detection system that identifies and draws both major and minor trendlines based on pivot highs and lows. This indicator uses sophisticated algorithms to detect market structure and automatically plot relevant trendlines, helping traders identify key support and resistance levels without manual chart analysis.
Key Features
Automatic Detection: Identifies pivot points and connects them to form trendlines without manual intervention
Multi-Level Analysis: Distinguishes between Major and Minor trendlines, both External and Internal
Smart Validation: Only draws trendlines that haven't been violated by price action
Comprehensive Alerts: 16 different alert conditions for breaks and reactions to trendlines
Fully Customizable: Complete control over colors, styles, widths, and display preferences for each trendline type
How It Works
The indicator uses a ZigZag algorithm with configurable pivot periods to identify significant highs and lows. It then connects these points to form trendlines, validating them against historical price action to ensure they remain relevant. The system categorizes trendlines into Major/Minor and External/Internal based on their significance in the market structure.
Use Cases
This indicator is particularly useful for:
Identifying trend continuations and potential reversals
Finding optimal entry and exit points based on trendline breaks
Setting stop-loss levels using trendline support/resistance
Confirming trade setups with multiple timeframe analysis
Automating trendline detection for systematic trading strategies
Settings/Parameters
Pivot Period: Controls the sensitivity of pivot detection (default: 5)
Display Options: Toggle visibility for each of the 8 trendline types
Style Customization: Adjust color, line style, width, and extension for each trendline
Alert Configuration: Enable/disable alerts for breaks and reactions to each trendline type
Delete Previous: Option to remove old trendlines when new ones are formed
How to Use
Add the indicator to your chart and adjust the Pivot Period based on your trading timeframe
Configure which trendline types you want to display (Major/Minor, External/Internal, Up/Down)
Set up alerts for the specific trendline interactions you want to monitor
Look for price reactions at trendlines for potential trade entries
Use trendline breaks as confirmation for trend changes
Signals
Break Alerts: Triggered when price closes beyond a trendline
React Alerts: Triggered when price touches but respects a trendline
Major External: Most significant trendlines based on major pivot points
Major Internal: Secondary major trendlines within the trend structure
Minor External: Short-term trendlines for intraday movements
Minor Internal: Smallest scale trendlines for precise entries
Trendline Types Explained
Up Trendlines: Connect ascending lows, act as support
Down Trendlines: Connect descending highs, act as resistance
External: Connect the outermost pivots
Internal: Connect pivots within the major structure
Best Timeframes
Works effectively on all timeframes:
Scalping: 1m, 5m, 15m charts
Day Trading: 15m, 1H, 4H charts
Swing Trading: 4H, Daily, Weekly charts
Position Trading: Daily, Weekly, Monthly charts
Important Notes
The indicator repaints trendlines as new pivots form - this is by design to maintain accuracy
Historical trendlines that have been broken are automatically extended to show past levels
Use multiple timeframe analysis for best results
Combine with other indicators for trade confirmation
Always use proper risk management
Alert Integration
This indicator uses the TradingFinder Alert Library for enhanced alert functionality, providing detailed notifications for all trendline interactions.
Version History
v6: Current version with full alert integration and enhanced trendline validation
Disclaimer: This indicator is for educational and informational purposes only. Past performance does not guarantee future results. Always conduct your own analysis and use proper risk management when trading.
Note: This is an overlay indicator that draws directly on your price chart. Ensure you have sufficient chart history loaded for optimal performance.
Korumalı komut dosyası
Bu komut dosyası kapalı kaynak olarak yayınlanmaktadır. Ancak, ücretsiz ve herhangi bir sınırlama olmaksızın kullanabilirsiniz – daha fazla bilgiyi buradan edinebilirsiniz.
Feragatname
Bilgiler ve yayınlar, TradingView tarafından sağlanan veya onaylanan finansal, yatırım, alım satım veya diğer türden tavsiye veya öneriler anlamına gelmez ve teşkil etmez. Kullanım Koşulları bölümünde daha fazlasını okuyun.