OPEN-SOURCE SCRIPT
Triple Stochastic
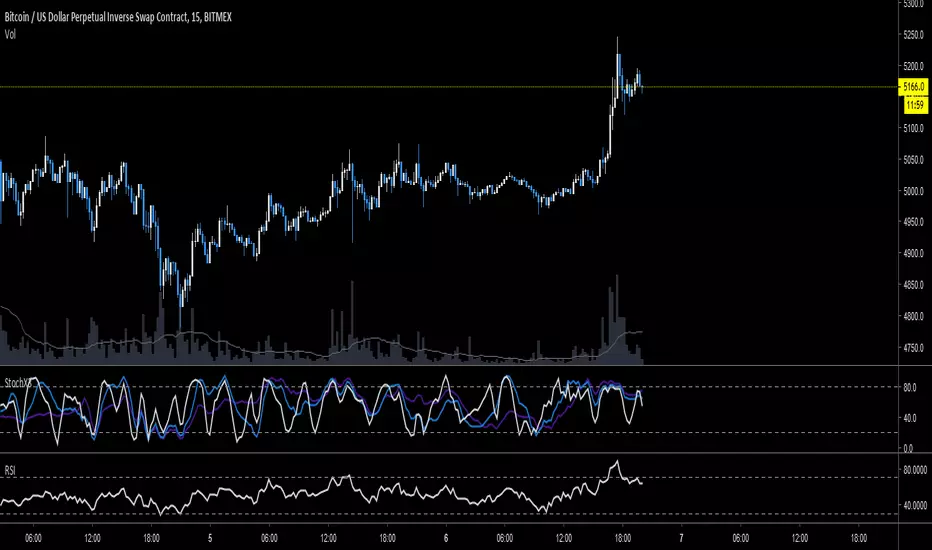
3 stochastic K-lines with short, medium & long periods & the D-lines removed.
Provides a good indication of where you are in the current supply/demand cycle & I find it helpful for timing entries.
Look for peaks & valleys formed by 2 or 3 lines, & entry would be when they start to turn around.
Try it on multiple timeframes & of course use confluence with other indicators & data.
Açık kaynak kodlu komut dosyası
Gerçek TradingView ruhuyla, bu komut dosyasının mimarı, yatırımcıların işlevselliğini inceleyip doğrulayabilmesi için onu açık kaynaklı hale getirdi. Yazarı tebrik ederiz! Ücretsiz olarak kullanabilseniz de, kodu yeniden yayınlamanın Topluluk Kurallarımıza tabi olduğunu unutmayın.
Feragatname
Bilgiler ve yayınlar, TradingView tarafından sağlanan veya onaylanan finansal, yatırım, alım satım veya diğer türden tavsiye veya öneriler anlamına gelmez ve teşkil etmez. Kullanım Koşulları bölümünde daha fazlasını okuyun.