OPEN-SOURCE SCRIPT
MTF MACD 4-Color Momentum System
🎯 Overview
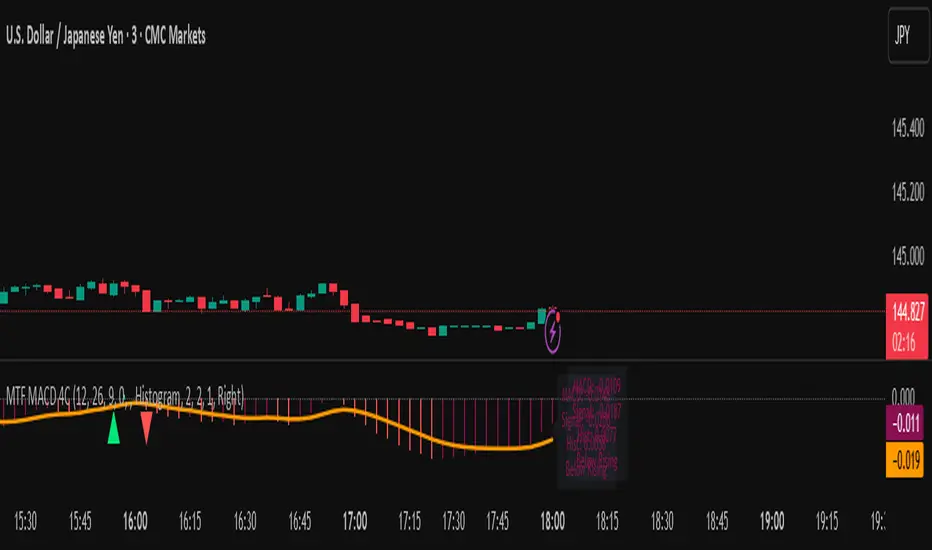
The MTF MACD 4-Color Momentum System is an advanced MACD indicator that provides crystal-clear momentum visualization through an innovative 4-color state system. Unlike traditional MACD indicators that only show positive/negative values, this indicator identifies four distinct market states to help traders make more informed decisions.
📊 Key Features
1. Four-State Color System:
🟢 Lime: Above zero + Rising (Strong Bullish Momentum)
🟢 Dark Green: Above zero + Falling (Weakening Bullish Momentum)
🔴 Red: Below zero + Falling (Strong Bearish Momentum)
🔴 Maroon: Below zero + Rising (Weakening Bearish Momentum)
2. Multi-Timeframe Analysis:
View higher timeframe MACD on lower timeframe charts
Confirm trends across multiple timeframes
Reduce false signals with multi-timeframe confluence
3. Flexible Display Options:
Three visualization styles: Histogram, Columns, or Line
Toggle individual color states on/off
Customizable colors and line widths
4. Advanced Features:
Optional histogram smoothing to reduce noise
Zero-cross alerts with visual markers
Color state change alerts
Real-time value display
Customizable signal line overlay
💡 How to Use
1. Momentum Identification:
Lime bars indicate strong upward momentum - ideal for long entries
Dark green suggests momentum is slowing - consider taking profits
Red bars show strong downward momentum - ideal for short entries
Maroon indicates potential reversal brewing - prepare for direction change
2. Zero Line Crosses:
Blue triangles mark bullish crosses above zero
Pink triangles mark bearish crosses below zero
Use these as confirmation signals with other indicators
3. Multi-Timeframe Confirmation:
Set to higher timeframe (e.g., 4H on 15m chart)
Look for alignment between timeframes before entering trades
Avoid trades against higher timeframe momentum
⚙️ Settings Guide
MACD Parameters:
Fast EMA: 12 (default) - Adjust for more/less sensitivity
Slow EMA: 26 (default) - Standard MACD setting
Signal: 9 (default) - Smoothing period
Display Customization:
Choose between Histogram, Columns, or Line display
Enable/disable specific color states
Adjust visual properties to match your chart theme
Alerts:
Zero cross alerts for trend changes
Color state alerts for momentum shifts
📈 Trading Strategies
1. Momentum Continuation:
Enter longs when MACD turns lime (above zero + rising)
Enter shorts when MACD turns red (below zero + falling)
Exit when color shifts to "weakening" state
2. Reversal Trading:
Watch for maroon in downtrends (potential bottom)
Watch for dark green in uptrends (potential top)
Confirm with price action and support/resistance
3. Multi-Timeframe Confluence:
Use daily MACD on 1H chart for trend direction
Enter on lower timeframe signals in direction of higher timeframe
Avoid counter-trend trades when higher timeframe shows strong momentum
🎓 Pro Tips
Combine with volume indicators for confirmation
Use with support/resistance levels for better entries
Enable smoothing in choppy markets to reduce false signals
Pay attention to divergences between price and MACD
⚠️ Risk Disclaimer
This indicator is for educational purposes only. Always use proper risk management and combine with other analysis methods. Past performance does not guarantee future results.
Açık kaynak kodlu komut dosyası
Gerçek TradingView ruhuyla, bu komut dosyasının mimarı, yatırımcıların işlevselliğini inceleyip doğrulayabilmesi için onu açık kaynaklı hale getirdi. Yazarı tebrik ederiz! Ücretsiz olarak kullanabilseniz de, kodu yeniden yayınlamanın Topluluk Kurallarımıza tabi olduğunu unutmayın.
Feragatname
Bilgiler ve yayınlar, TradingView tarafından sağlanan veya onaylanan finansal, yatırım, alım satım veya diğer türden tavsiye veya öneriler anlamına gelmez ve teşkil etmez. Kullanım Koşulları bölümünde daha fazlasını okuyun.