Renko Ghost, v. 2.0
Custom-designed to take advantage of the smoothing signals from Renko charting, Renko Ghost creates client-side ATR calculations to build an overlay of “ghost” Renko blocks which emulate the popular ATR blocks on top of TradingView’s Traditional Renko charts. By combining constant ATR updates with the “trend anticipation” patterning of our other systems, Renko Ghost can deliver more responsive, finely-tuned reads on market turns. (Check out results below) Contact us for a free trial to test Renko Ghost on your go-to charts. And be sure to check out our other dynamic trading systems.
We are always available for questions, comments, and suggestions. There is always room for improvement.
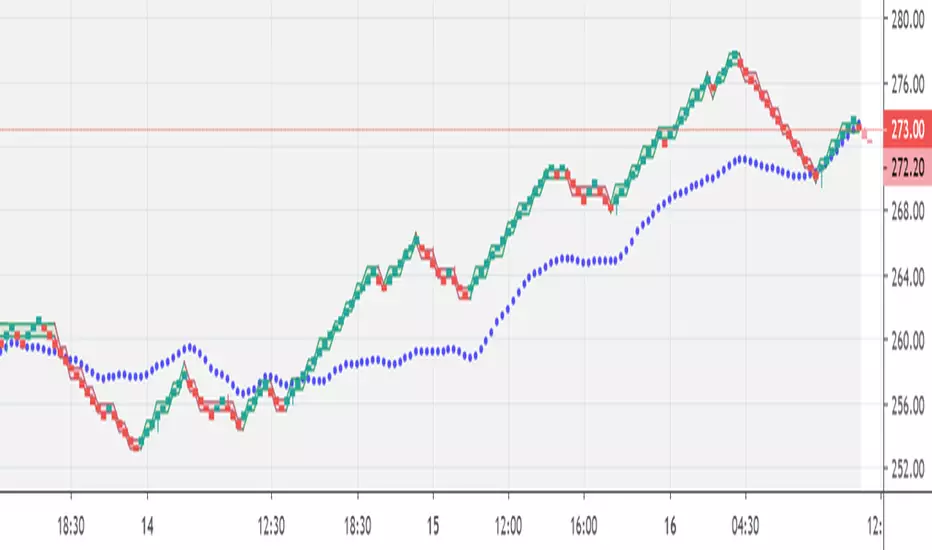
Results Chart
The backtests below show 1-year returns against a Buy and Hold (B+H) approach for 40 of the world’s top traded instruments (as measured by price volume or similar indicator). The Renko Ghost system was run on the top 10 instruments in four major markets: Equities, ETFs, Cryptocurrencies, and Forex. All tests were on a 30min chart, set to Renko “Traditional” blocks (because TradingView does not support realtime alerts from ATR-based charts). Block size was set proportionately to price to give the instrument positive results, but there was no “cherry-picking”. (In fact, changing time frames would have produced even better returns in some cases, but it seemed best to use a consistent measure.) Subscribers to the system receive a full, step-by-step breakdown on how to customize the parameters to get the best from their favorite markets.
(For each instrument, you see listed its Symbol (name), Profit % (annual return using Renko Ghost), Winning Trade % (being “right”), ProfitFactor (Ratio of money won to money lost), Max Draw Down % (point of worst % loss during the year), and B+H (how much the asset would have returned with no trades, via "buy-and-hold" )...)
Renko Ghost
Settings: 30 min, Traditional Renko box, over 1 year (June 1, 2018 - June 1, 2019)
EQUITIES
Symbol,_.,_.Profit %,_.Trade %,_.Pf,_.Max Dr Dn,_.B + H
AMZN,_.,_.,_.1,874,_.,_.62,_.,_.6.3,_.,_.3,_.,_.,_.,_.7
AAPL,_.,_.,_.,_.141,_.,_.48,_.,_.3.4,_.,_.5,_.,_.,_.,_.5
TSLA,_.,_.,_._6,603,_.,_.58,_.,_.5.6,_.,_.6,_.,_.,_.(-38)
FB,_.,_.,_.,_.,_.170,_.,_.48,_.,_.3,_.,_.,_8,_.,_.,_.(-7)
BABA,_.,_.,_.,_.220,_.,_.56,_.,_.3.2,_.,_.9,_.,_.,_.(-23)
BYND,_.,_.,_.,_.305,_.,_.60,_.,_.7.1,_.,_.5,_.,_.,_,_140
MSFT,_.,_.,_.,_.191,_.,_.57,_.,_.6,_.,_.,_3,_.,_.,_.,,_28
AMD,_.,_.,_.,_.,142,_.,_.45,_.,_.2.3,_.,_13,_.,_.,_.,_,0
NFLX_,_.,_.,_.1,902,_.,_.54,_.,_.1.4,_.,_11,_.,_.,_.,(-5)
BA,_.,_.,_.,_.,_.560,_.,_.54,_.,_.4.9,_.,_.3,_.,_.,_.,,_97
ETFs
Symbol,_.Profit %,_.Trade %,_.Pf,_.Max DrDn,_.B + H
SPY,_.,_.,_.724,_.,_.64,_.,_.,_8.3,_.,_.1,_.,_.,_.4
QQQ,_.,_.2,553,_.,_.63,_.,_.,_9.3,_.,_.1,_.,_.,_.5
EEM,_.,_.,_.340,_.,_.52,_.,_.,_5.5,_.,_.2,_.,_.,_.0
IWM,_.,_.,1,801,_.,_.61,_.,_.,_7.7,_.,_.1,_.,_.,(-3)
HYG,_.,_.,_.,17,_.,_.45,_.,_.,_2.5,_.,_.1,_.,_.,,0.5
EWZ,_.,_.4,855,_.,_.59,_.,_.,_9.2,_.,_.2,_.,_.,_.26
LQD,_.,_.,_.,12,_.,_.48,_.,_.,_1.7,_.,_.2,_.,_.,_.6
EFA,_.,_.,_.192,_.,_.52,_.,_.,_4.9,_.,_.2,_.,_.,_(-7)
FXI,_.,_.,_.669,_.,_.55,_.,_.,_6.3,_.,_.,1,_.,_.,(-15)
XLF,_.,_.,_.287,_.,_.55,_.,_.,_4.8,_.,_.,2,_.,_.,(-3)
CRYPTOCURRENCIES
Symbol,_.,_.Profit %,_.Trade %,_.Pf,_.Max DrDn,_.B + H
BTC/USD,_.22 million,_.,_.54,_.,8.1,_.,_3,_.,_.,_.(-8)
ETH/USD,_.15 million,_.,_.50,_.,5.1,_.,_7,_.,_.,_(-54)
XRP/USD,_.26 million,_.,_.49,_.,4.3,_.,_8,_.,_.,_(-21)
LTC/USD,_.785,000,_.,_.,_50,_.,5,_.,_.,12,_.,_.,_.13
BCH/USD,_.756,000,_.,_.,_46,_.,3.6,_.,15,_.,_.,_.(-5)
EOS/USD,_.258,000,_.,_.,_47,_.,3.5,_.,,27,_.,_.,_.13
BNB/USDT,_22 million,_.,_55,_.,7.3,_.,_.8,_.,_.,_143
BSV/USD,_.170,000,_.,_.,_64,.100,_.,_.,,4,_.,_.,_(-8)
XLM/USD,_.15 billion,_.,_.61,_.,7.7,_.,_.5,_.,_.,_.34
ADA/USD,_.136,000,_.,_.,70,_.20,_.,_.,_.2,_.,_.,_.3
FOREX PAIRS
Symbol,_.,_.Profit %,_.Trade %,_.Pf,_.Max Dr Dn,_.B + H
EUR/USD,_.,_.13,_.,_.,_36,_.,_.,1.5,_.,_.,_2,_.,_.,_(-4)
USD/JPY,_.,_.,,5,_.,_.,_31,_.,_.,1.2,_.,_.,_2,_.,_.,_(-1)
AUD/USD,_.,_.26,_.,_.,_44,_.,_.,2,_.,_.,_.,3,_.,_.,_.10
USD/CAD,_.,_.16,_.,_.,_37,_.,_.,1.6,_.,_.,_2,_.,_.,_.,3
GBP/USD,_.,_.37,_.,_.,_37,_.,_.,1.7,_.,_.,_2,_.,_.,_(-5)
NZD/USD,_.,_.24,_.,_.,_50,_.,_.,2,_.,_.,_.,2,_.,_.,_(-6)
GBP/JPY,_.,_.57,_.,_.,_41,_.,_.,1.8,_.,_.,_3,_.,_.,_(-6)
EUR/JPY,_.,_.19,_.,_.,_39,_.,_.,1.4,_.,_.,_4,_.,_.,_(-5)
AUD/JPY,_.,_.50,_.,_.,_36,_.,_.,1.7,_.,_.,_4,_.,_.,(-10)
EUR/GBP,_.,_.13,_.,_.,_41,_.,_.,1.4,_.,_.,_3,_.,_.,_0.1
Yalnızca davetli komut dosyası
Bu komut dosyasına yalnızca yazar tarafından yetkilendirilen kullanıcılar erişebilir ve bu genellikle ödeme gerektirir. Bu komut dosyasını favorilerinize ekleyebilirsiniz, ancak yalnızca yazarından izin istedikten ve aldıktan sonra kullanabilirsiniz — daha fazla bilgi burada. Daha fazla ayrıntı için yazarın aşağıdaki talimatlarını izleyin veya doğrudan vogoninvictus ile iletişime geçin.
TradingView, yazarına tam olarak güvenmediğiniz ve nasıl çalıştığını anlamadığınız sürece bir komut dosyası için ödeme yapmanızı veya kullanmanızı ÖNERMEZ. Ayrıca topluluk komut dosyaları bölümümüzde ücretsiz, açık kaynaklı alternatifler bulabilirsiniz.
Yazarın talimatları
Uyarı: Erişim talebinde bulunmadan önce lütfen yalnızca davetli komut dosyaları kılavuzumuzu okuyun.
Feragatname
Yalnızca davetli komut dosyası
Bu komut dosyasına yalnızca yazar tarafından yetkilendirilen kullanıcılar erişebilir ve bu genellikle ödeme gerektirir. Bu komut dosyasını favorilerinize ekleyebilirsiniz, ancak yalnızca yazarından izin istedikten ve aldıktan sonra kullanabilirsiniz — daha fazla bilgi burada. Daha fazla ayrıntı için yazarın aşağıdaki talimatlarını izleyin veya doğrudan vogoninvictus ile iletişime geçin.
TradingView, yazarına tam olarak güvenmediğiniz ve nasıl çalıştığını anlamadığınız sürece bir komut dosyası için ödeme yapmanızı veya kullanmanızı ÖNERMEZ. Ayrıca topluluk komut dosyaları bölümümüzde ücretsiz, açık kaynaklı alternatifler bulabilirsiniz.
Yazarın talimatları
Uyarı: Erişim talebinde bulunmadan önce lütfen yalnızca davetli komut dosyaları kılavuzumuzu okuyun.